Fig. 7
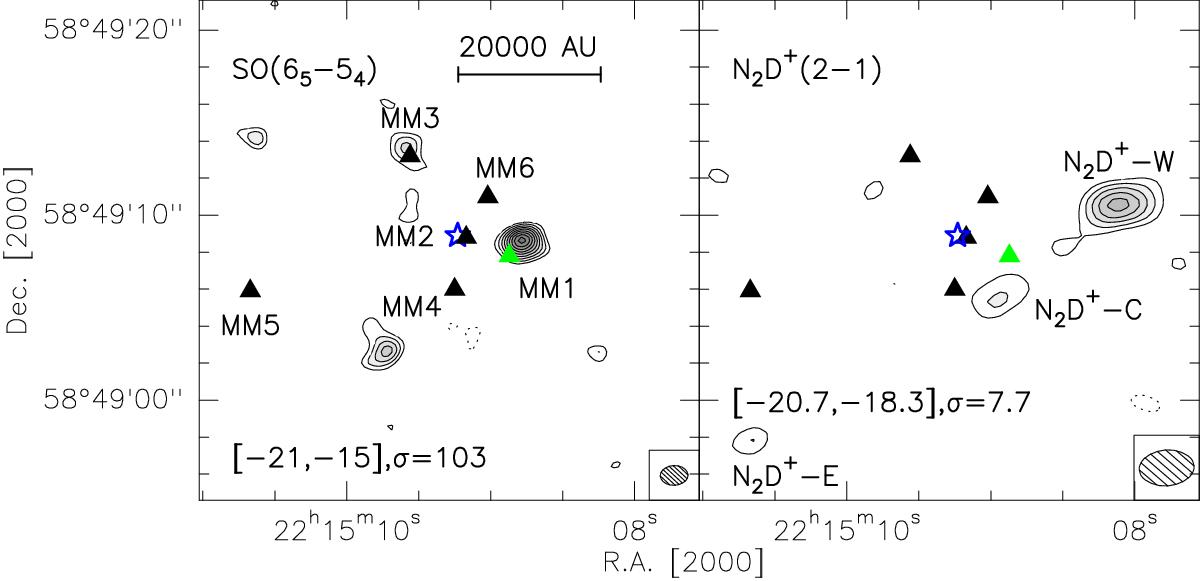
SMA SO(6–5) and PdBI N2D+(2–1) integrated intensity maps. Contour levels start at 3σ and increase in steps of 1σ. The σ value and the integrated velocity ranges of each transition are shown in the respect map in the units of mJy beam-1 km s-1 and km s-1, respectively. The star marks the UCHii region and the triangles the 2 mm continuum sources. The dotted contours are the negative features due to the missing flux with the same contour levels as the positive ones in each panel. The synthesized beam is shown in the bottom right corner of each panel.
Current usage metrics show cumulative count of Article Views (full-text article views including HTML views, PDF and ePub downloads, according to the available data) and Abstracts Views on Vision4Press platform.
Data correspond to usage on the plateform after 2015. The current usage metrics is available 48-96 hours after online publication and is updated daily on week days.
Initial download of the metrics may take a while.