Fig. 6
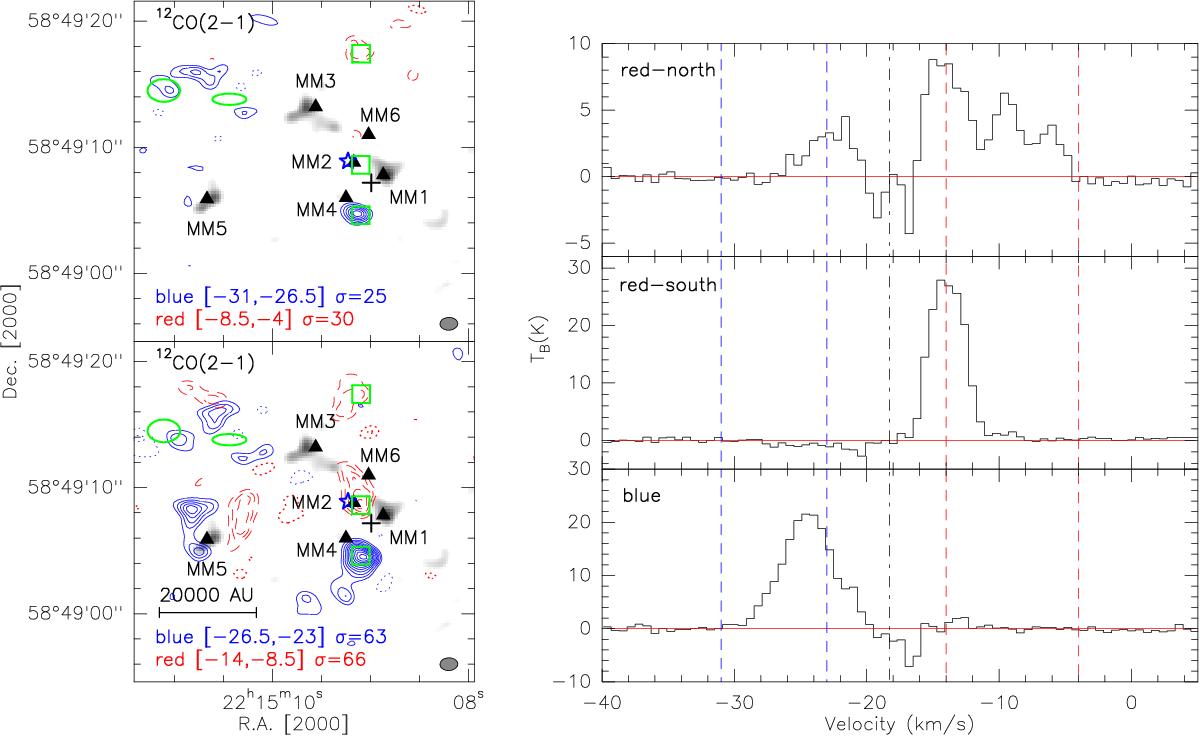
SMA 12CO(2–1) outflow maps overlaid with the SMA 1.3 mm continuum map (left), and the average 12CO(2–1) spectra extracted from the peaks of the red- and blueshifted emission denoted by squares in the left panels. Top-left panel shows the high velocity outflow map, and the bottom left one shows the low-velocity outflow map. In both panels, the full and dashed contours show the blueshifted and redshifted 12CO(2–1) outflow emission, respectively. All the contour levels start at 4σ and increase with a step of 2σ/level. The σ value and velocity-integration range of each outflow emission are shown in the bottom of the left panel in units of mJy beam-1 and km s-1, respectively. Two open ellipses indicate the nebulous H2 emission detected by Kumar et al. (2002). The cross marks the infrared source that was suggested by Palau et al. (2013) as the driving source of the outflow. The triangles indicate the positions of our 2 mm cores. The dotted contours are the negative features due to the missing flux with the same contour levels as the positive ones in the panel. The synthesized beam of the outflow map is shown in the bottom right corner of the left panel. The squares at the peaks of the red and blue outflow lobes with the size of 1![]() show the area where we extracted the spectra shown in the right panels. In the right panels, the dashed lines indicate the velocity regimes we used to define the outflow emission, the dashed-dotted line marks the vLSR = −18.3 km s-1.
show the area where we extracted the spectra shown in the right panels. In the right panels, the dashed lines indicate the velocity regimes we used to define the outflow emission, the dashed-dotted line marks the vLSR = −18.3 km s-1.
Current usage metrics show cumulative count of Article Views (full-text article views including HTML views, PDF and ePub downloads, according to the available data) and Abstracts Views on Vision4Press platform.
Data correspond to usage on the plateform after 2015. The current usage metrics is available 48-96 hours after online publication and is updated daily on week days.
Initial download of the metrics may take a while.