Fig. 5
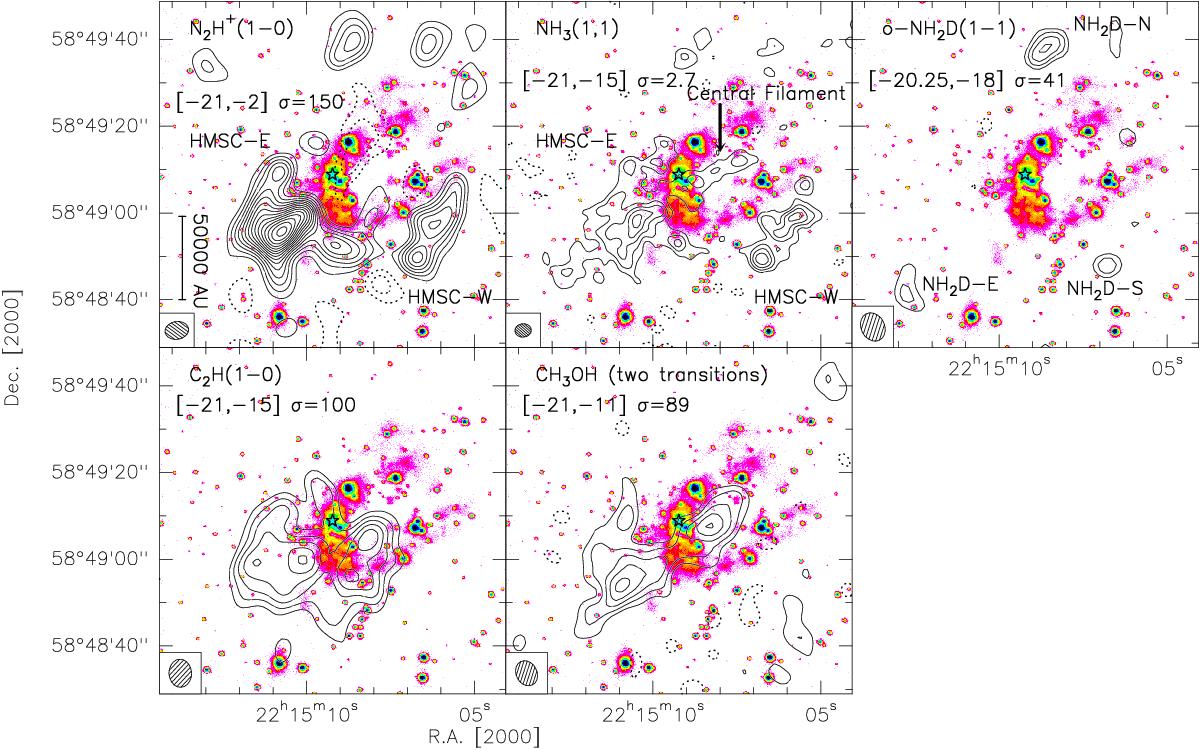
UKIRT K-band image and large scale molecular-line-integrated intensity maps. The contour levels start at 3σ and increase with a step of 2σ/level in all panels. The σ value and the integrated velocity ranges of each transition are shown in the relative map in the units of mJy beam-1 km s-1 and km s-1, respectively. As the integrated velocity ranges show, we include all the hyperfine components N2H+(1–0) for the integrated intensity map, and for NH3(1, 1) we integrate only the main group of hyperfine components. The star indicates the UCHii region, and the crosses the ring-shaped cluster of infrared sources identified by Kumar et al. (2003). The dotted contours are the negative features due to the missing flux with the same contour levels as the positive ones in each panel. The synthesized beam is shown in the bottom left corner of each panel.
Current usage metrics show cumulative count of Article Views (full-text article views including HTML views, PDF and ePub downloads, according to the available data) and Abstracts Views on Vision4Press platform.
Data correspond to usage on the plateform after 2015. The current usage metrics is available 48-96 hours after online publication and is updated daily on week days.
Initial download of the metrics may take a while.