Fig. 4
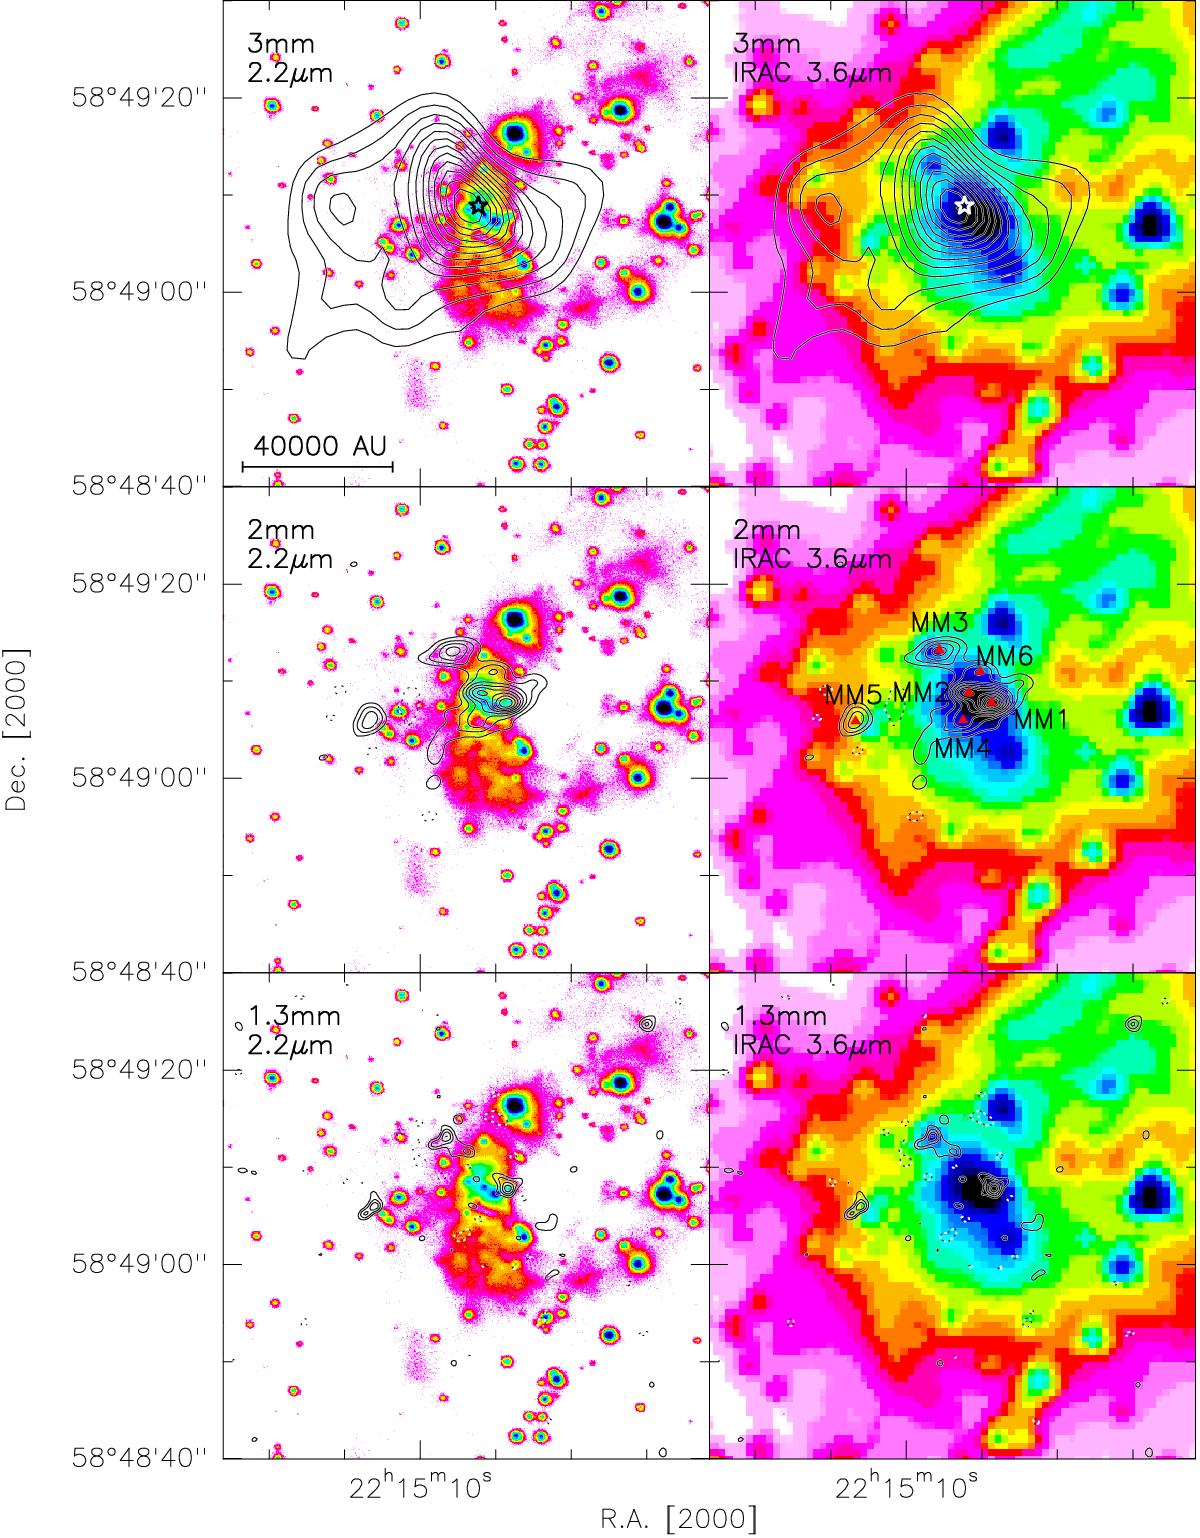
Millimeter continuum map obtained with the CARMA, PdBI, and SMA overlaid with UKIRT K-band (2.2 μm, left) and Spitzer/IRAC 3.6 μm (right) images. Contour levels start at 3σ in steps of 2σ in all panels. The stars in the top panels mark the UCHii region VLA1. The UKIRT K-band image is from Kumar et al. (2003). The Spitzer/IRAC post-bcd data processed with pipeline version S18.25.0 have been downloaded from the Spitzer archive to create these images.
Current usage metrics show cumulative count of Article Views (full-text article views including HTML views, PDF and ePub downloads, according to the available data) and Abstracts Views on Vision4Press platform.
Data correspond to usage on the plateform after 2015. The current usage metrics is available 48-96 hours after online publication and is updated daily on week days.
Initial download of the metrics may take a while.