Fig. 3
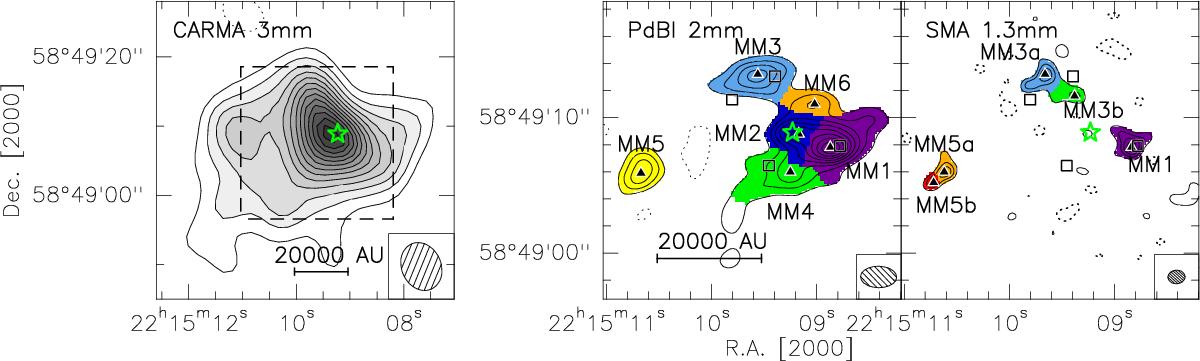
Millimeter continuum map obtained with the CARMA (left), PdBI (middle), and SMA (right). Contour levels start at 3σ in steps of 2σ. The σ of the contours in each panel, from left to right, is 0.38, 0.26, and 0.50 mJy beam-1, respectively. The dashed box in the left panel indicates the region plotted in the middle and right panels. The color scales in the PdBI and SMA panels show the core structures and boundaries derived from the ClumpFind procedure, the triangles and the numbers label the peaks as listed in Table 6. The star marks the UCHii region VLA1. The squares indicate the cores detected by Palau et al. (2013). The dotted contours are the negative features due to the missing flux with the same contour levels as the positive ones in each panel. The synthesized beam is shown in the bottom right corner of each panel.
Current usage metrics show cumulative count of Article Views (full-text article views including HTML views, PDF and ePub downloads, according to the available data) and Abstracts Views on Vision4Press platform.
Data correspond to usage on the plateform after 2015. The current usage metrics is available 48-96 hours after online publication and is updated daily on week days.
Initial download of the metrics may take a while.