Fig. 2
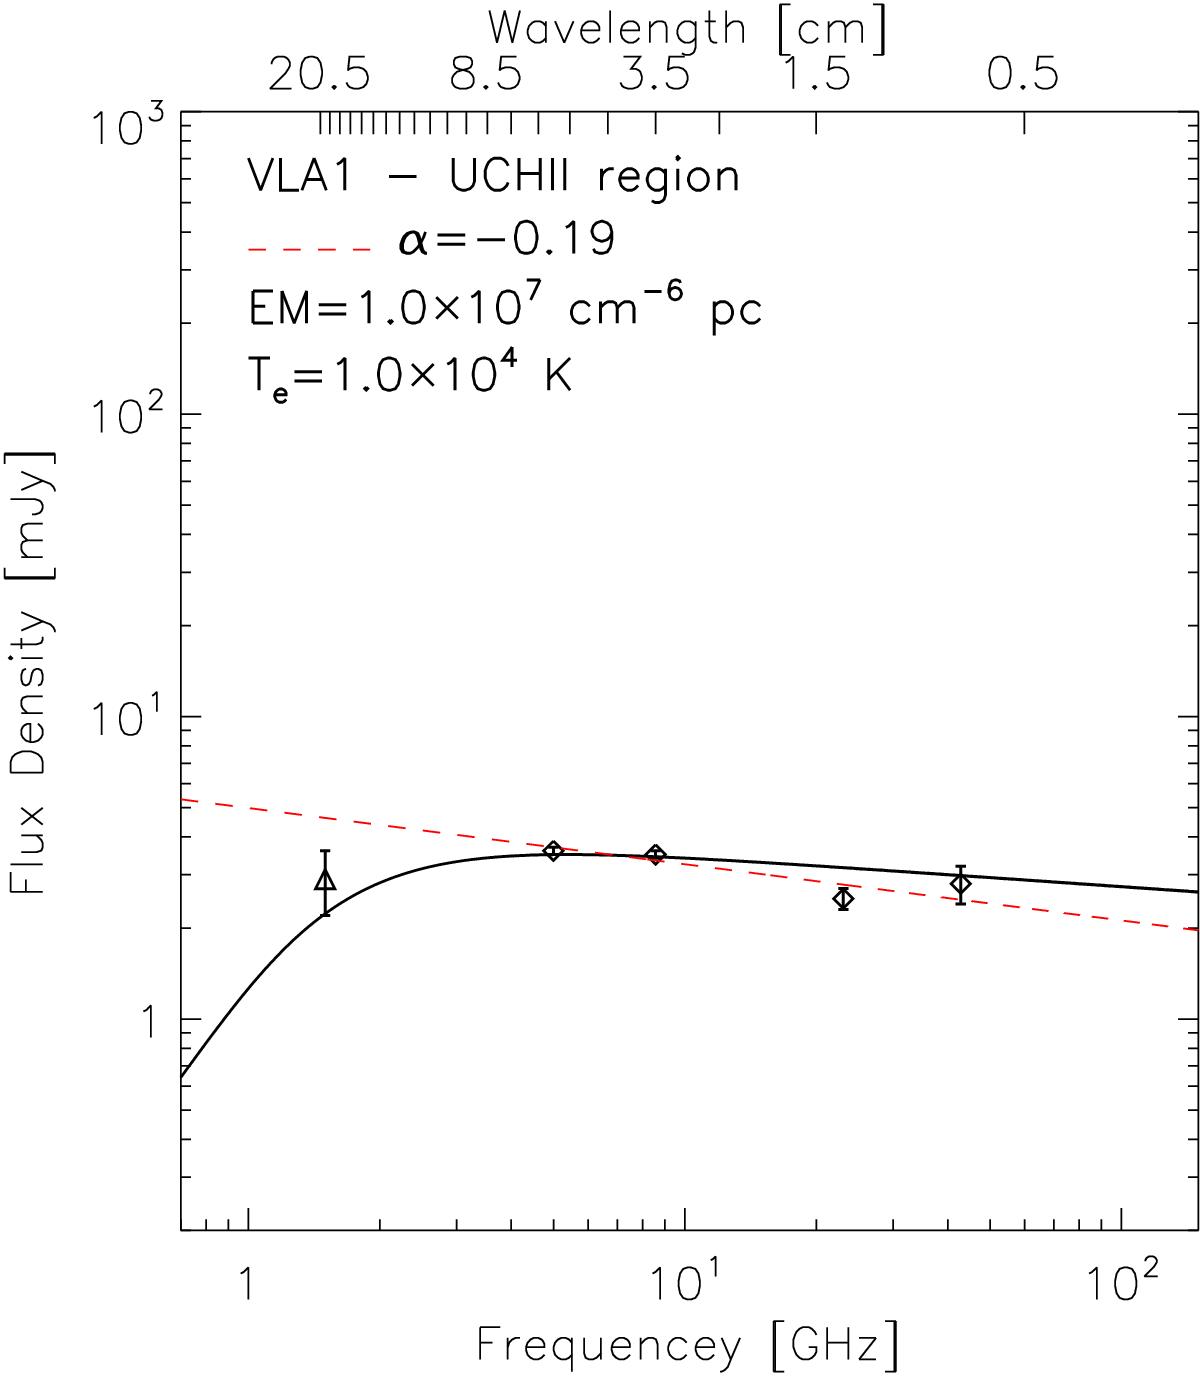
Spectral energy distribution for radio source VLA1. Diamonds correspond to the VLA high-angular resolution flux measurements listed in Table 5. The triangle corresponds to the 20 cm flux measurement in Table 4. The dashed line shows the linear fit (Sν ∝ να) to the high-angular resolution data (diamonds) with α = −0.19. The solid line shows a homogeneous Hii region fit to all the data points in the figure.
Current usage metrics show cumulative count of Article Views (full-text article views including HTML views, PDF and ePub downloads, according to the available data) and Abstracts Views on Vision4Press platform.
Data correspond to usage on the plateform after 2015. The current usage metrics is available 48-96 hours after online publication and is updated daily on week days.
Initial download of the metrics may take a while.