Fig. 17
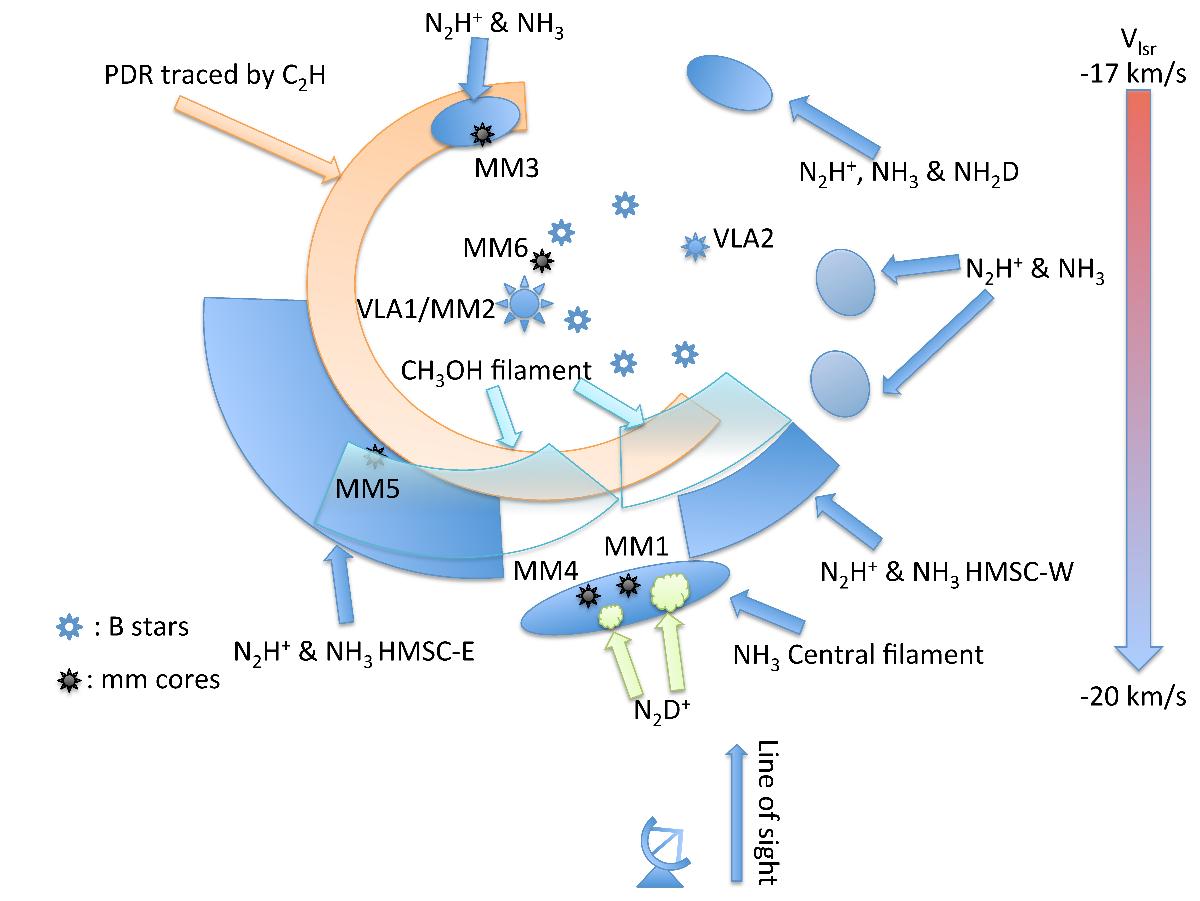
General picture of I22134 according to the kinetic properties of the molecular line observations, not scaled. The blue ellipses and block indicate the dense clouds traced by different molecules as labeled in the figure. The two green clouds mark the N2D+ cores, the orange arc shows the PDR traced by C2H, the light blue blocks show the possible shocked emission traced by CH3OH, the small stars the B stars in the cluster (Kumar et al. 2003), the big filled star the UCHii region VLA1, the small filled star marks VLA2, the black stars the millimeter cores from our observations. The antenna shows our observation point.
Current usage metrics show cumulative count of Article Views (full-text article views including HTML views, PDF and ePub downloads, according to the available data) and Abstracts Views on Vision4Press platform.
Data correspond to usage on the plateform after 2015. The current usage metrics is available 48-96 hours after online publication and is updated daily on week days.
Initial download of the metrics may take a while.