Fig. 16
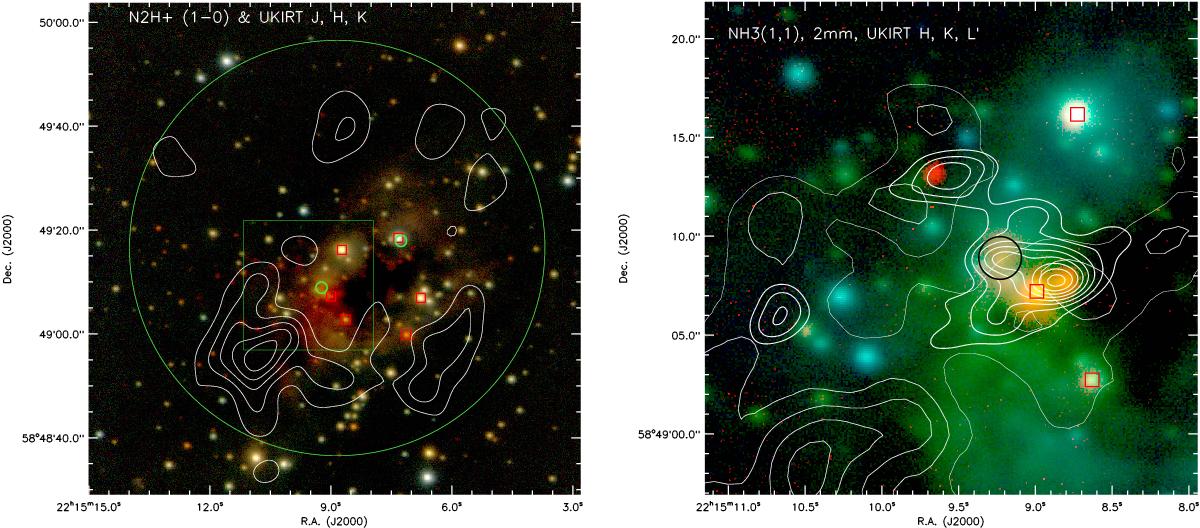
Left: N2H+(1–0) integrated intensity contours overlaid on J (blue), H (green), and K (red) three-color image obtained from Kumar et al. (2003). Contour levels start from 3σ with 6σ per level. The big circle indicates the size of the expanding bubble, the small circle in the center the size of the UCHii region VLA1. The red squares label the B stars identified by Kumar et al. (2003). Right: zoom into the region shown with the green box in the left panel, the integrated intensity contours of the NH3(1, 1) main group of hyperfine components (thin contours), 2 mm continuum emission (thick contours) overlaid on H (blue), and K (green), and L′ (red) three-color image (Kumar et al. 2003). The contour level parameters are the same as in Figs. 3 and 5. The red squares indicate the B stars identified by Kumar et al. (2003), and the circle the UCHii region VLA1.
Current usage metrics show cumulative count of Article Views (full-text article views including HTML views, PDF and ePub downloads, according to the available data) and Abstracts Views on Vision4Press platform.
Data correspond to usage on the plateform after 2015. The current usage metrics is available 48-96 hours after online publication and is updated daily on week days.
Initial download of the metrics may take a while.