Fig. 15
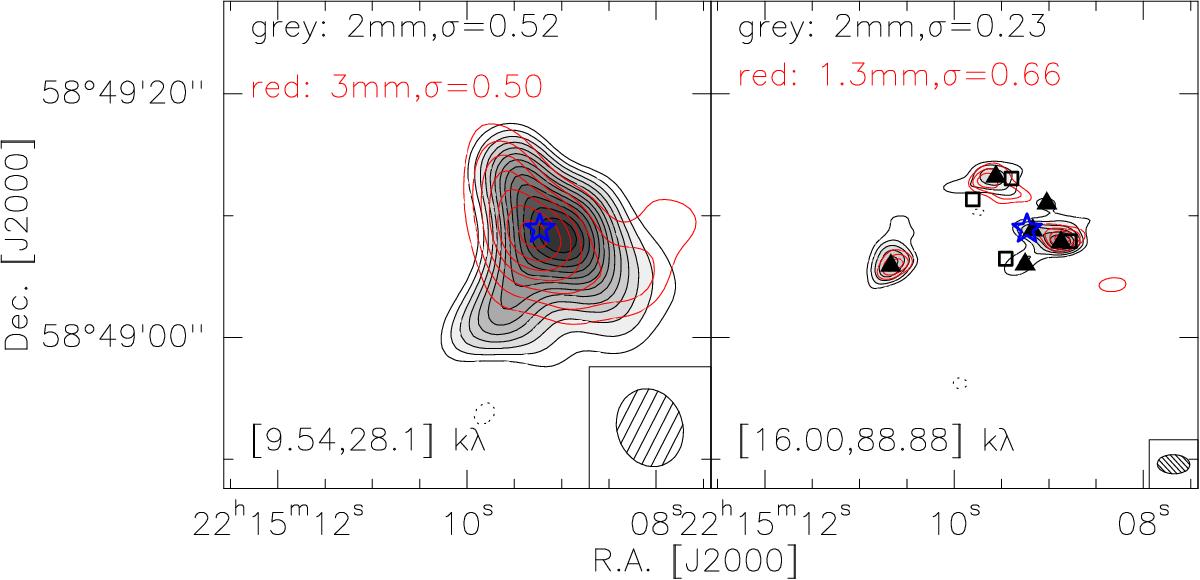
Convolved mm continuum maps. Left: the 3 mm continuum map (red) overlaid on the 2 mm continuum map (gray scale and black contours), where both maps were produced with the same uv-range and same beam size. Right: the 1.3 mm continuum map (red) overlaid on the 2 mm continuum map (gray scale and black contours), where both maps were produced with the same uv-range and same beam size. The triangles mark the 2 mm cores, and the squares the 1.3 mm cores detected by Palau et al. (2013). The star indicates the UCHii region VLA1. All the contours in both panels start at 4σ and increase in steps of 2σ. The σ value in mJy beam-1 and the uv-range are shown in respect panel. The dotted contours are the negative features due to the missing flux with the same contour levels as the positive ones in each panel. The synthesized beam is shown in the bottom right corner of each panel.
Current usage metrics show cumulative count of Article Views (full-text article views including HTML views, PDF and ePub downloads, according to the available data) and Abstracts Views on Vision4Press platform.
Data correspond to usage on the plateform after 2015. The current usage metrics is available 48-96 hours after online publication and is updated daily on week days.
Initial download of the metrics may take a while.