Fig. 14
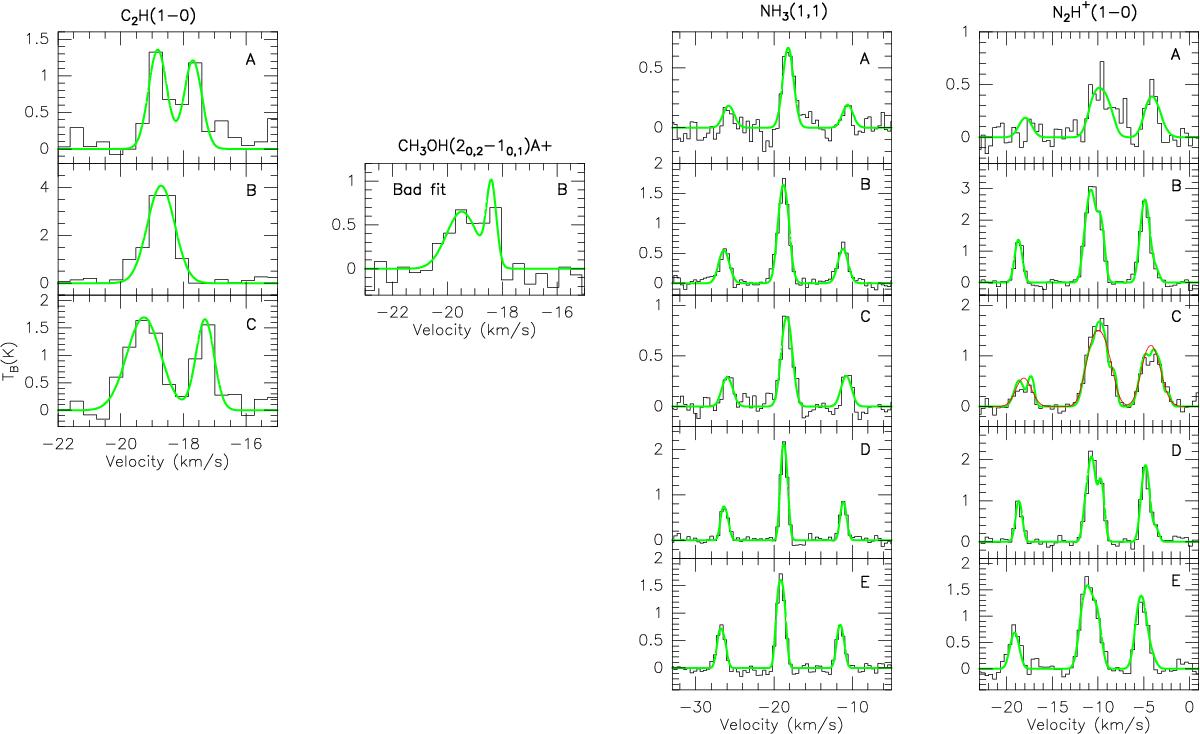
Extracted spectra from the regions marked in Figs. 10 and 11. The thick lines show the fitted profile of the spectra. Gaussian fittings were performed for CH3OH spectra and C2H(N = 1–0) spectra at positions A and C with two velocity components. The spectrum of C2H(N = 1–0) at position B is fit with one velocity component. Single velocity component hyperfine structure profile fittings are done for all NH3(1, 1) spectra and N2H+(1–0) spectra except the one from position C, in which the thick green line shows the two velocity component fitting and the thin line red shows the one component fitting.The velocity of N2H+(1–0) spectra is offset by ~8 km s-1 because the rest frequency was set at the frequency of the isolated hyperfine component (F1,F = 0,1 → 1,2). The results from the fittings are listed in Table 8.
Current usage metrics show cumulative count of Article Views (full-text article views including HTML views, PDF and ePub downloads, according to the available data) and Abstracts Views on Vision4Press platform.
Data correspond to usage on the plateform after 2015. The current usage metrics is available 48-96 hours after online publication and is updated daily on week days.
Initial download of the metrics may take a while.