Fig. 13
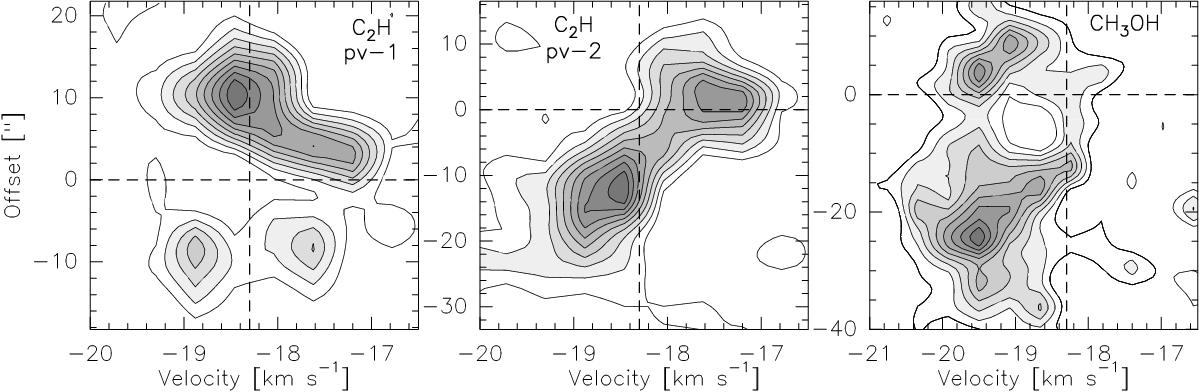
Position-velocity (PV) diagrams of C2H and CH3OH with a velocity resolution of 0.42 km s-1. The PV cuts are shown in the respect velocity map (Fig. 10). The contour levels are from 10% to 90% from the peak emission (from left to right, 0.74, 0.69, and 0.88 Jy beam-1, respectively) in steps of 10%. The offsets refer to the distance along the cuts from the reference position, which is, from left to right, the dust continuum peak of MM1, the cross position of pv-1 and pv-2 in Fig. 10, and the cross in the CH3OH panel in Fig. 10, respectively. The vLSR at –18.3 km s-1 and the reference position are indicated by vertical and horizontal dashed lines.
Current usage metrics show cumulative count of Article Views (full-text article views including HTML views, PDF and ePub downloads, according to the available data) and Abstracts Views on Vision4Press platform.
Data correspond to usage on the plateform after 2015. The current usage metrics is available 48-96 hours after online publication and is updated daily on week days.
Initial download of the metrics may take a while.