Fig. 12
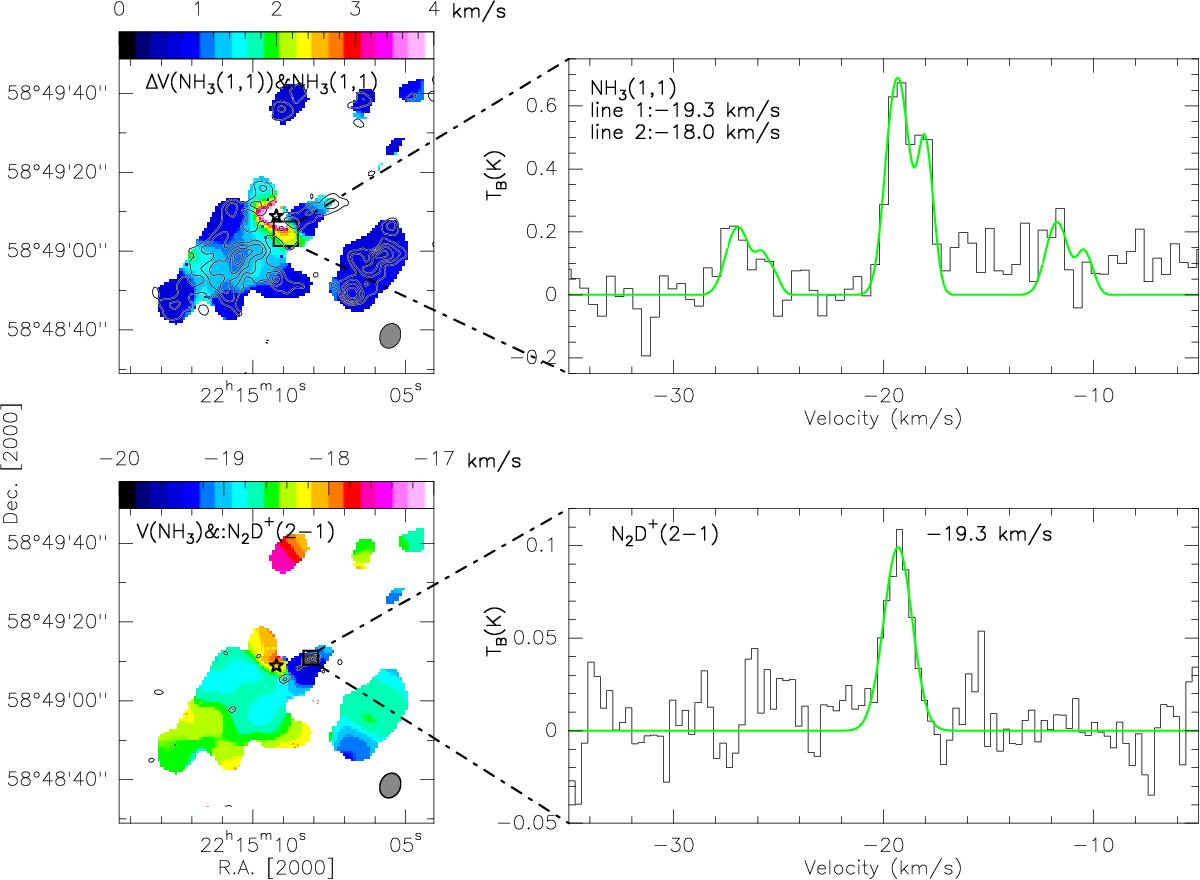
Top: NH3(1, 1) line-width map overlaid with the NH3(1, 1) integrated intensity map and the average NH3(1, 1) spectrum extracted from the region outlined with the box in the line-width map. Bottom: NH3(1, 1) velocity map overlaid with N2D+(2–1) integrated intensity map, N2D+(2–1) average spectrum extracted toward the emission peak indicated with the box in the velocity map.
Current usage metrics show cumulative count of Article Views (full-text article views including HTML views, PDF and ePub downloads, according to the available data) and Abstracts Views on Vision4Press platform.
Data correspond to usage on the plateform after 2015. The current usage metrics is available 48-96 hours after online publication and is updated daily on week days.
Initial download of the metrics may take a while.