Fig. 10
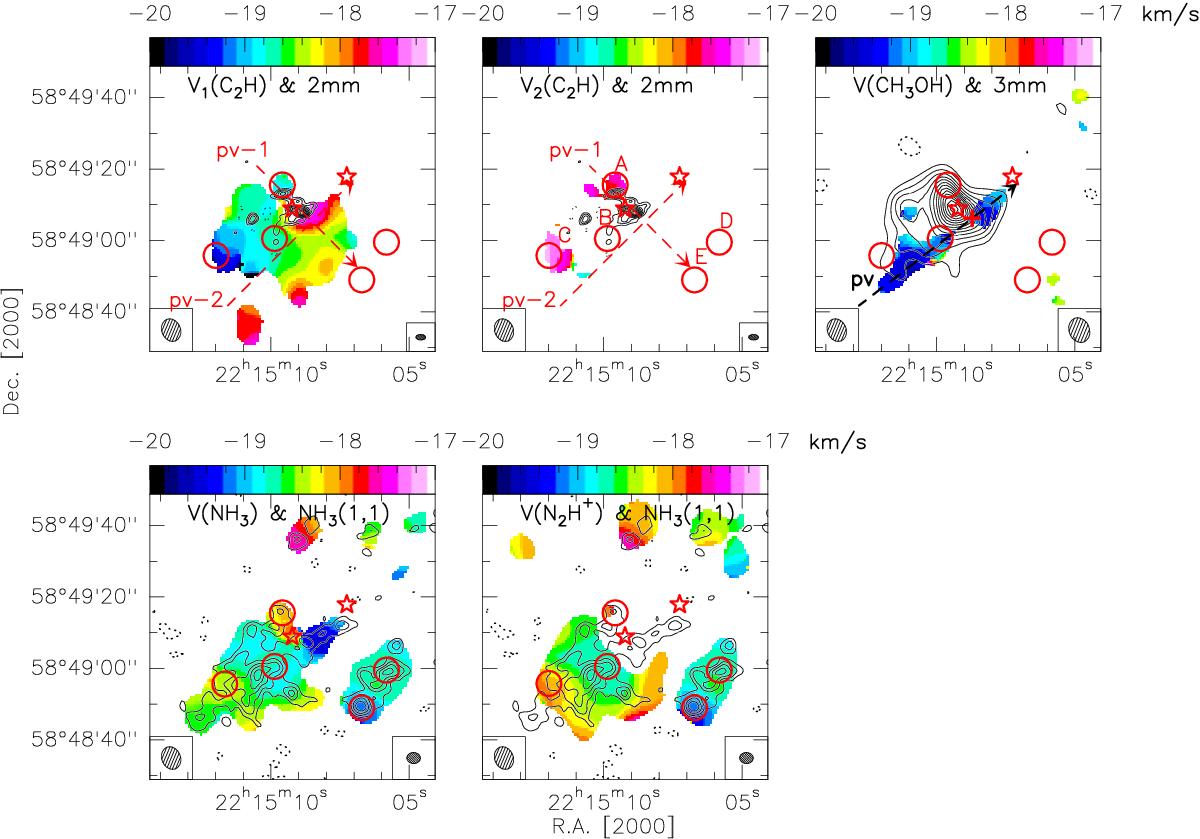
Molecular line velocity maps overlaid with 2 mm, 3 mm continuum map and the NH3(1, 1) integrated intensity map. The contour level parameters are the same as the ones in Figs. 3 and 5. The dashed arrows in the top panels mark the PV-cuts used for PV diagrams in Fig. 13. The star marks the UCHii region. The cross in the top right panel indicates the reference position in CH3OH PV diagram in Fig. 13. The circles indicate the area where the average spectra are extracted and shown in Fig. 14. The synthesized beam of the velocity maps is shown in the bottom left corner of each panel, and the one of the contours is shown in the bottom right corner of respect panel.
Current usage metrics show cumulative count of Article Views (full-text article views including HTML views, PDF and ePub downloads, according to the available data) and Abstracts Views on Vision4Press platform.
Data correspond to usage on the plateform after 2015. The current usage metrics is available 48-96 hours after online publication and is updated daily on week days.
Initial download of the metrics may take a while.