Fig. 1
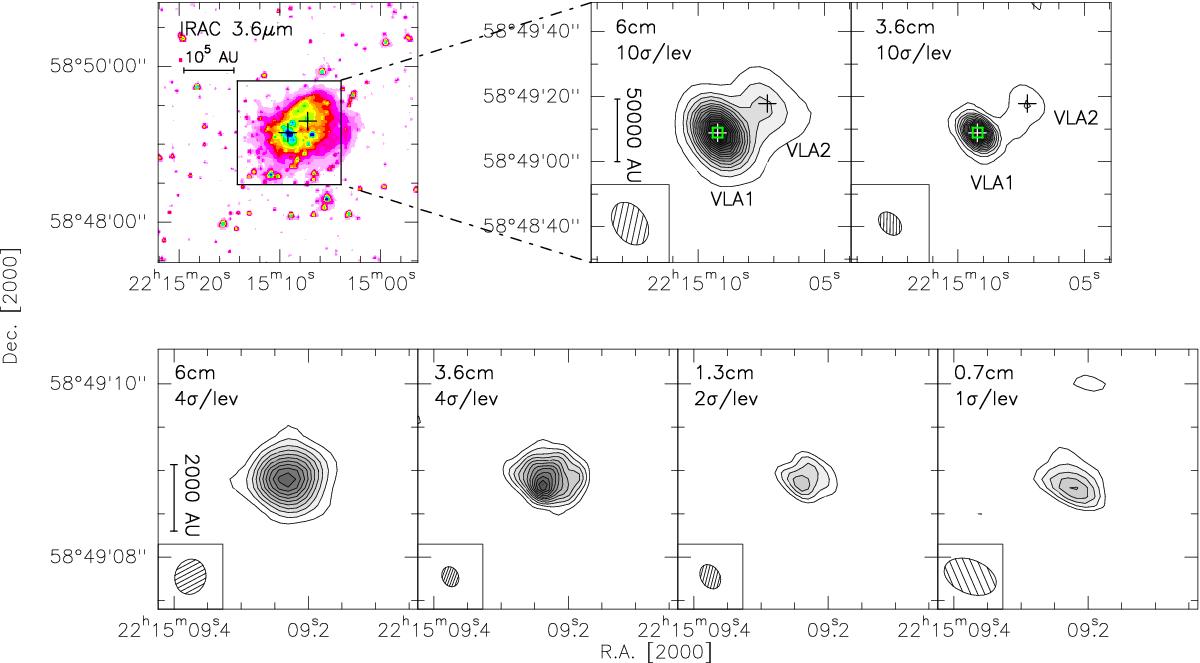
Spitzer/IRAC and (E)VLA continuum emission images. Top: Spitzer/IRAC 3.6 μm, ELVA (D-config) 6.0 cm and 3.6 cm continuum images. Bottom: the VLA 6.0 cm (A-config), 3.6 cm (A-config), 1.3 cm (B-config), and 0.7 cm (C-config) continuum images. The boxes in the EVLA continuum images in the top indicate the zoomed region in bottom panels. All the contour levels start at 4σ, and the steps are shown in each panel. The σ values are listed in Table 4. The crosses in the top panels mark the two radio sources we detected. The synthesized beams are shown in the bottom left corner of each panel. The Spitzer/IRAC post-bcd data processed with pipeline version S18.25.0 have been downloaded from the Spitzer archive to create the image.
Current usage metrics show cumulative count of Article Views (full-text article views including HTML views, PDF and ePub downloads, according to the available data) and Abstracts Views on Vision4Press platform.
Data correspond to usage on the plateform after 2015. The current usage metrics is available 48-96 hours after online publication and is updated daily on week days.
Initial download of the metrics may take a while.