Fig. 7
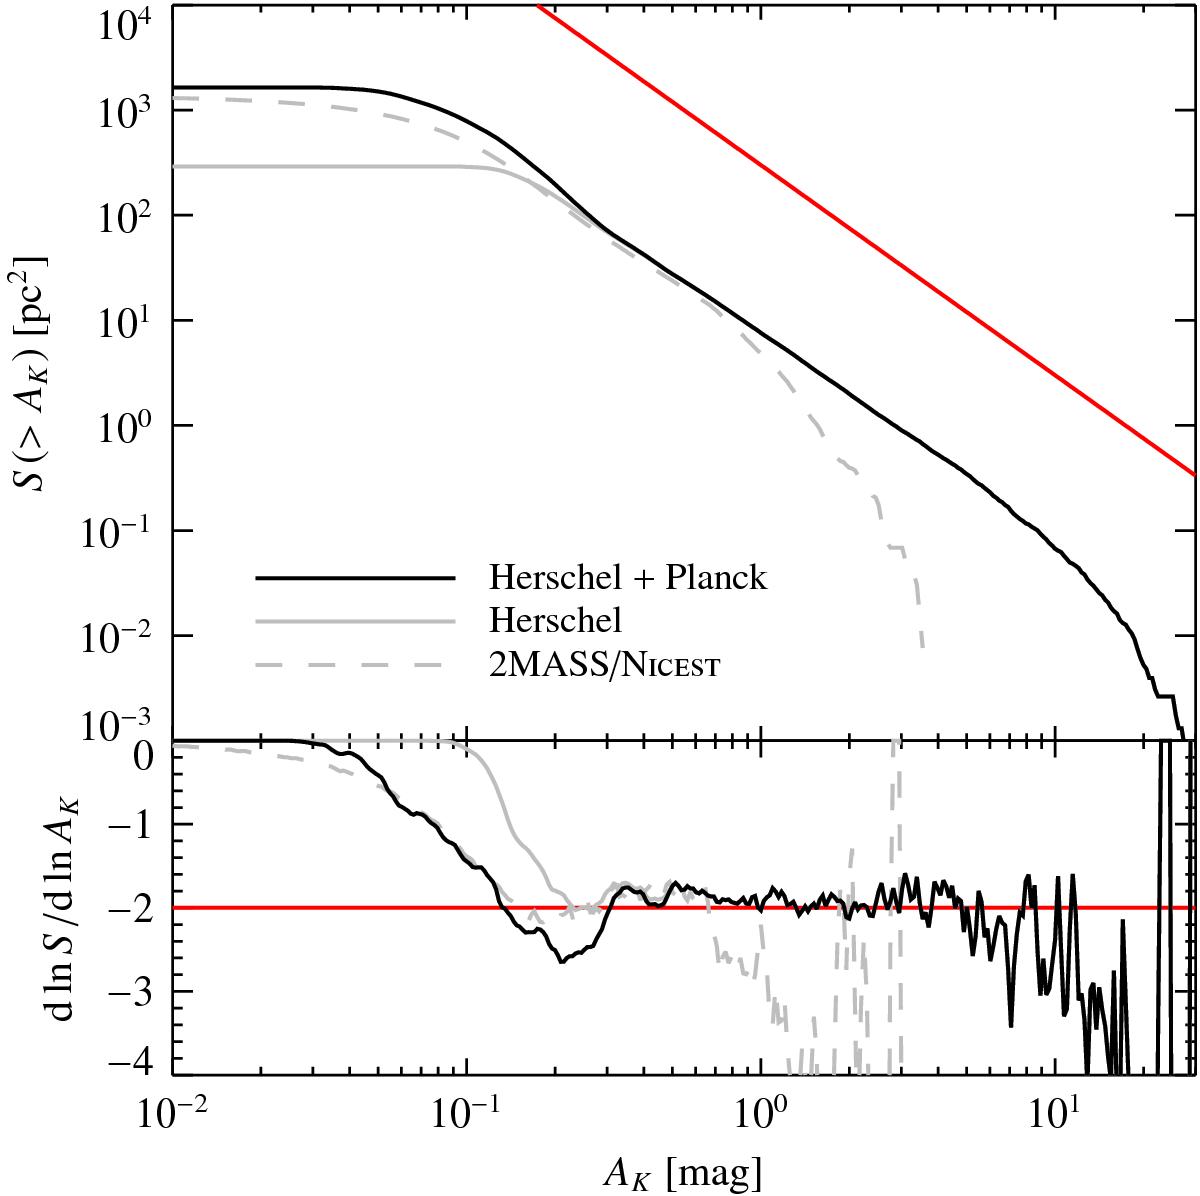
Integral area-extinction relation for Perseus, i.e., the physical cloud area above a given extinction threshold as a function of that threshold. The solid black line shows the result for the entire field, while the solid gray line shows the same quantity for the Herschel regions. The dashed line shows again the same quantity, but for the 2MASS/NICEST data. The red line shows the slope of the power law ![]() .
.
Current usage metrics show cumulative count of Article Views (full-text article views including HTML views, PDF and ePub downloads, according to the available data) and Abstracts Views on Vision4Press platform.
Data correspond to usage on the plateform after 2015. The current usage metrics is available 48-96 hours after online publication and is updated daily on week days.
Initial download of the metrics may take a while.