Fig. 5
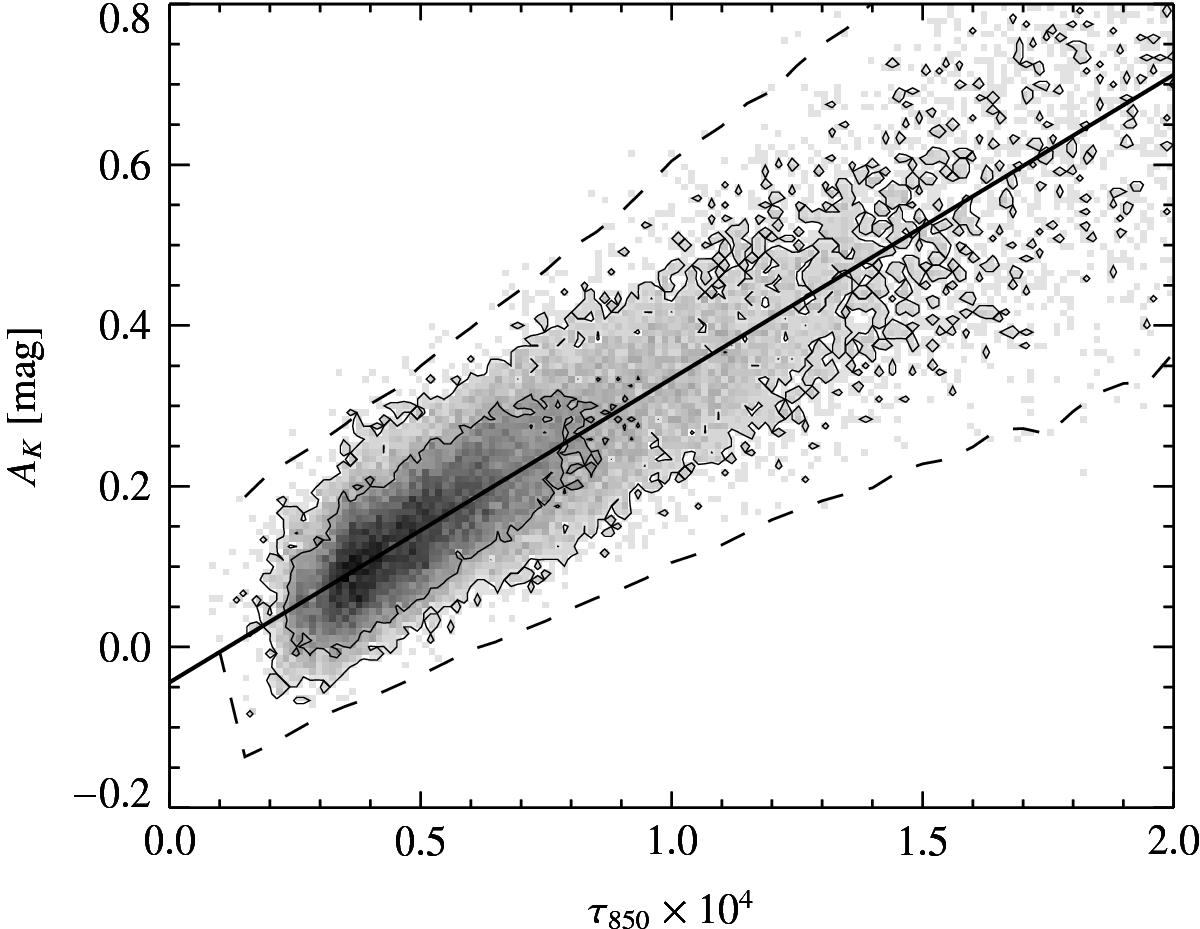
Relationship between submillimitre optical depth and NIR extinction in Perseus. The image shows the best linear fit, used to calibrate the data (solid line), together with the expected 3σ region (dashed lines), as calculated from direct error propagation in the extinction map. The contours enclose the 68% and the 95% of the points, respectively.
Current usage metrics show cumulative count of Article Views (full-text article views including HTML views, PDF and ePub downloads, according to the available data) and Abstracts Views on Vision4Press platform.
Data correspond to usage on the plateform after 2015. The current usage metrics is available 48-96 hours after online publication and is updated daily on week days.
Initial download of the metrics may take a while.