Fig. 3
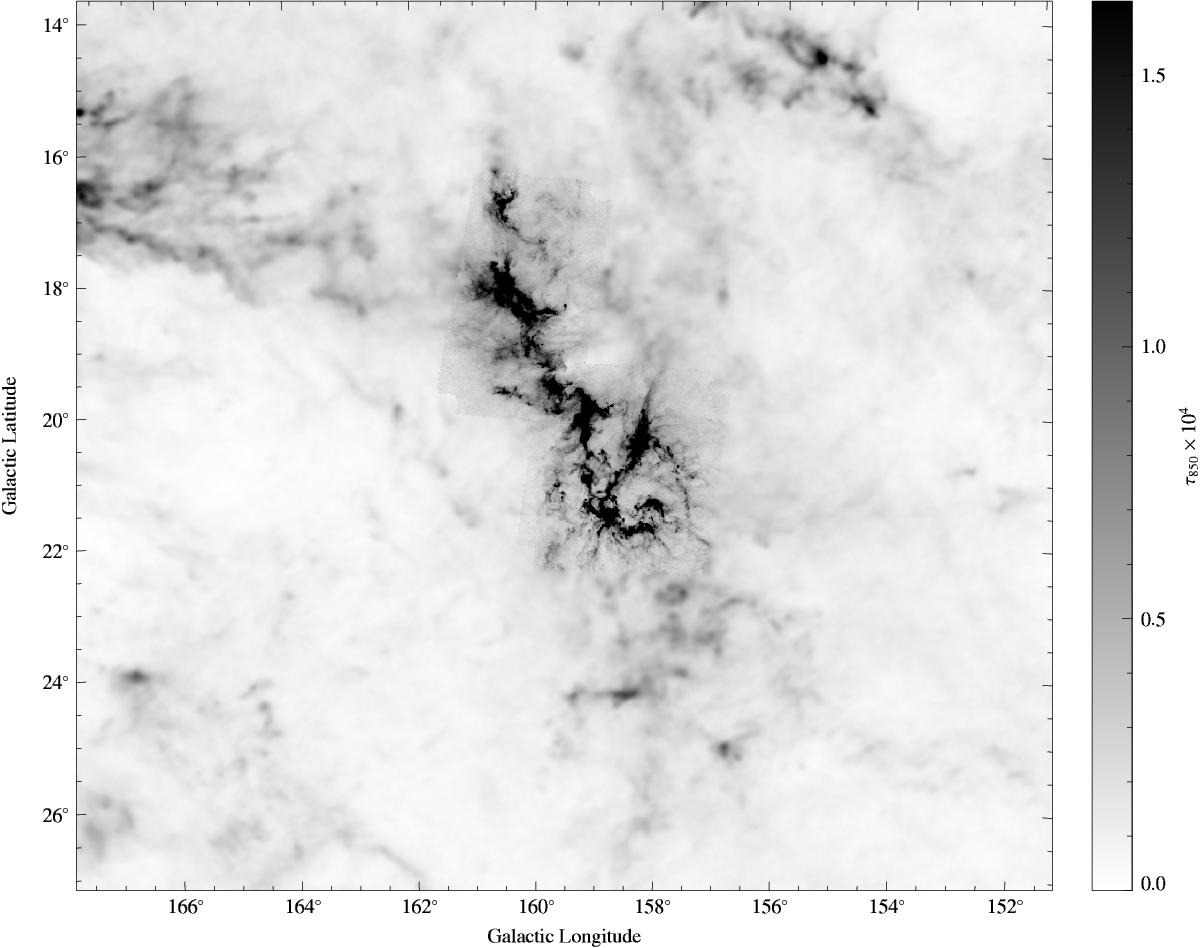
Optical depth map of the field and, on a different layer, the corresponding error map. This figure, as for the following one (Fig. 3), is produced by the method described in the text, using the reduced fluxes of SPIRE and the expected fluxes at SPIRE frequencies that were deduced from the Planck maps (Planck Collaboration XI 2014).
Current usage metrics show cumulative count of Article Views (full-text article views including HTML views, PDF and ePub downloads, according to the available data) and Abstracts Views on Vision4Press platform.
Data correspond to usage on the plateform after 2015. The current usage metrics is available 48-96 hours after online publication and is updated daily on week days.
Initial download of the metrics may take a while.