Fig. A.3
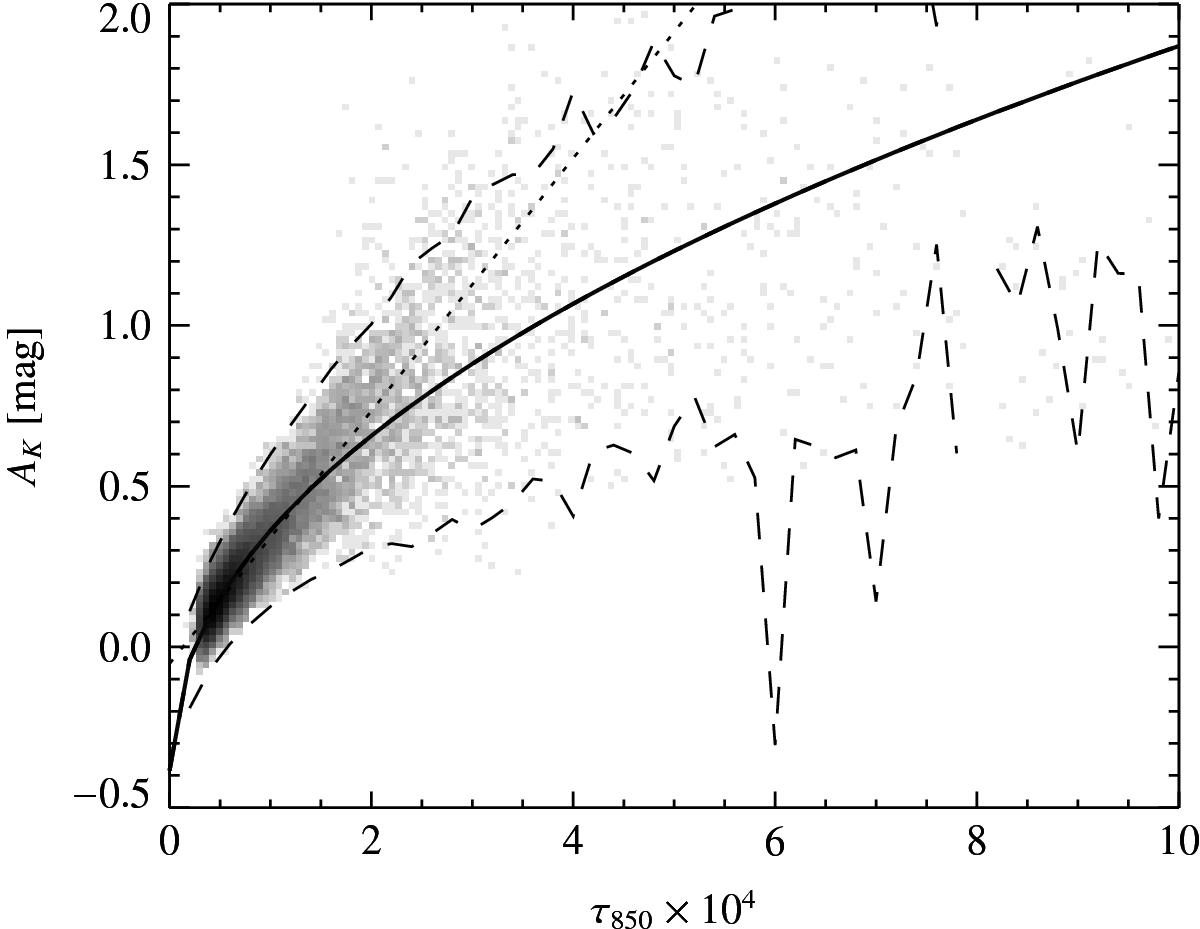
Relation between 353 GHz optical depth and the infrared NICEST extinction map, for τ850 × 104 ≤ 10. The relation deviates from the linearity for high extinction values, as shown by the fit (solid line).The dashed lines represent the expected 3σ region. We also report in this plot the linear fit shown in Fig. 5 (dotted line).
Current usage metrics show cumulative count of Article Views (full-text article views including HTML views, PDF and ePub downloads, according to the available data) and Abstracts Views on Vision4Press platform.
Data correspond to usage on the plateform after 2015. The current usage metrics is available 48-96 hours after online publication and is updated daily on week days.
Initial download of the metrics may take a while.