Free Access
Fig. 12
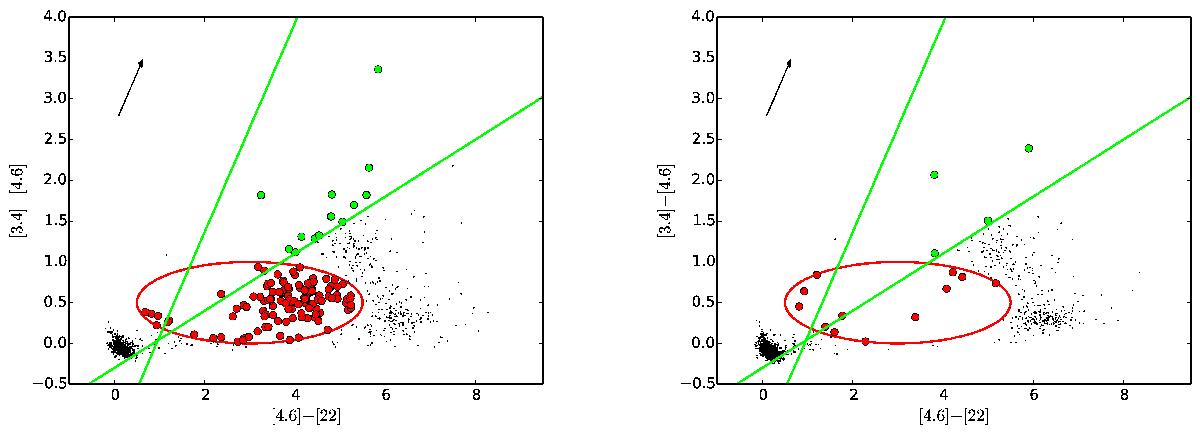
W1−W2 vs. W2−W4 diagram of the science and the control field. Red points represent candidate Class II YSOs, green points represent candidate Class I protostars, while black points represent the other sources in the field. The red ellipse and the green slopes have equations specified in the text.
This figure is made of several images, please see below:
Current usage metrics show cumulative count of Article Views (full-text article views including HTML views, PDF and ePub downloads, according to the available data) and Abstracts Views on Vision4Press platform.
Data correspond to usage on the plateform after 2015. The current usage metrics is available 48-96 hours after online publication and is updated daily on week days.
Initial download of the metrics may take a while.