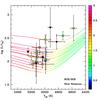
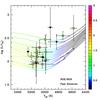
Fig. 7
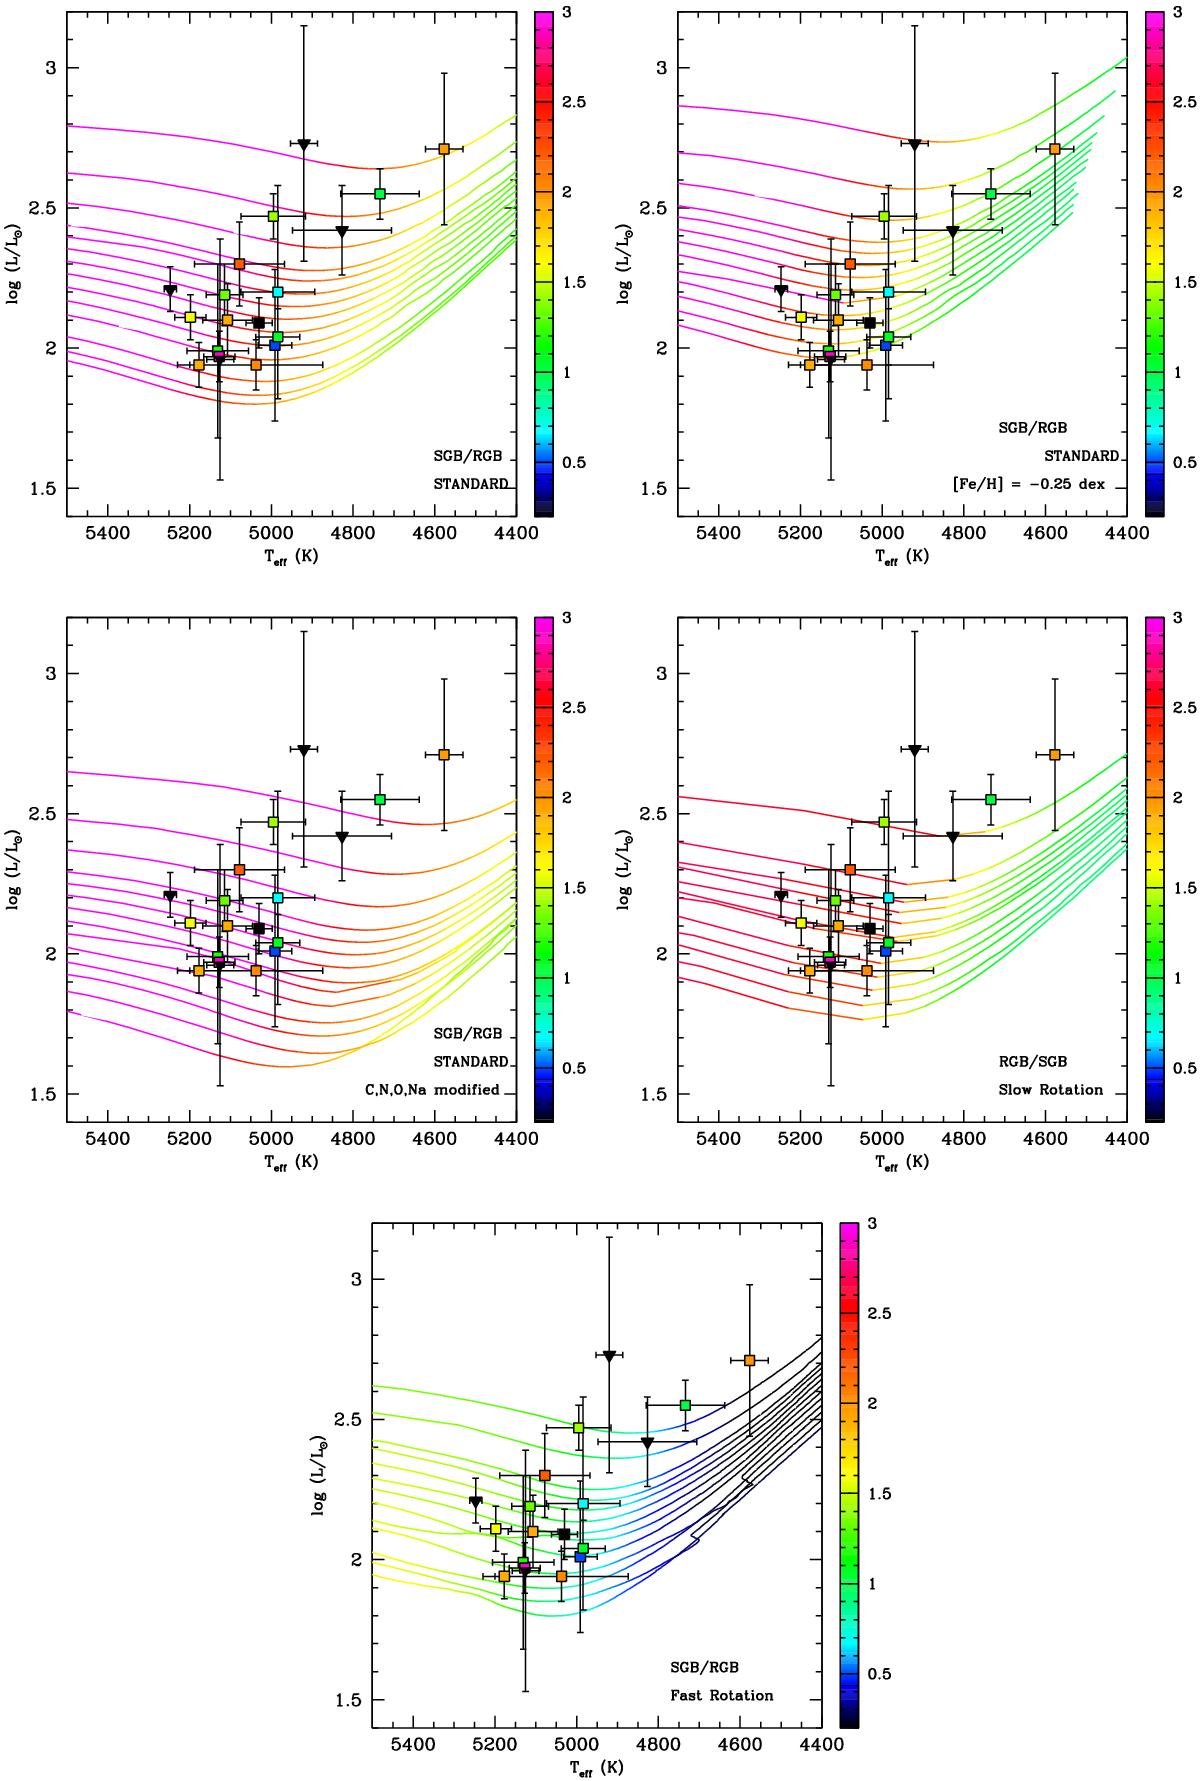
Hertzsprung-Russell diagrams for the models of the different grids described in Table 6. Only the part of the tracks associated with the subgiant and red giant phases is plotted here. The colour code of the tracks indicates the surface abundance of lithium (see colour scale on plots). Our data points are overplotted with the same lithium abundance colour-coding used for the evolutionary tracks. The tracks correspond to models with initial masses between 3 M⊙ (least luminous track) and 5 M⊙ (most luminous track).
Current usage metrics show cumulative count of Article Views (full-text article views including HTML views, PDF and ePub downloads, according to the available data) and Abstracts Views on Vision4Press platform.
Data correspond to usage on the plateform after 2015. The current usage metrics is available 48-96 hours after online publication and is updated daily on week days.
Initial download of the metrics may take a while.