Fig. 12
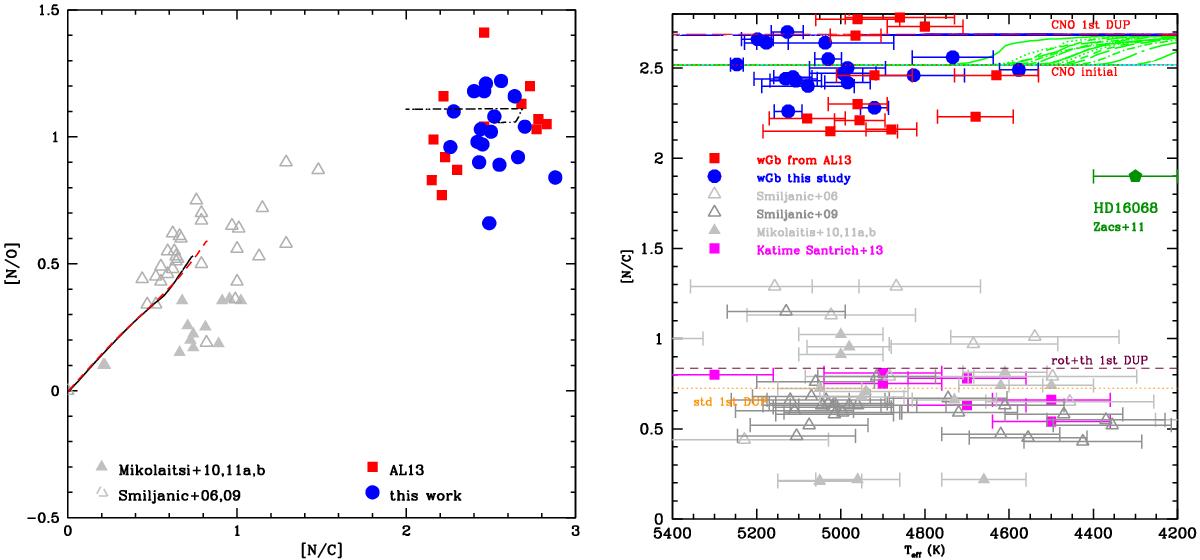
C, N, and O in the wGb stars and other intermediate-mass giants. Left: [N/O] as a function of [N/C] for the stars in our sample (blue dots) that are in common with AL13 (red squares) compared with abundances in intermediate-mass stars of the field from Smiljanic et al. (2006), and of open clusters from Smiljanic et al. (2009; open grey triangles), Mikolaitis et al. (2010; 2011a,b; filled grey triangles), and Santrich et al. (2013; magenta filled squares). Also shown are the predictions from standard stellar evolution models of 3 M⊙ and 4 M⊙ including rotational and thermohaline mixing from Lagarde et al. (2012; solid black line and red dashed line in the lower left part of the plot) and from our CNO models (short-long-dashed line). Right: [N/C] as a function of temperature for the wGb stars and the same intermediate-mass red giants as on the left plot. An additional point, the giant HD 16068 from the solar metallicity open cluster Tr2, is also plotted after Začs et al. (2011). The lines represent the expected post 1st DUP value of [N/C] predicted by our different models as labelled. For the CNO models we also show the main sequence value of this ratio.
Current usage metrics show cumulative count of Article Views (full-text article views including HTML views, PDF and ePub downloads, according to the available data) and Abstracts Views on Vision4Press platform.
Data correspond to usage on the plateform after 2015. The current usage metrics is available 48-96 hours after online publication and is updated daily on week days.
Initial download of the metrics may take a while.