Fig. 6
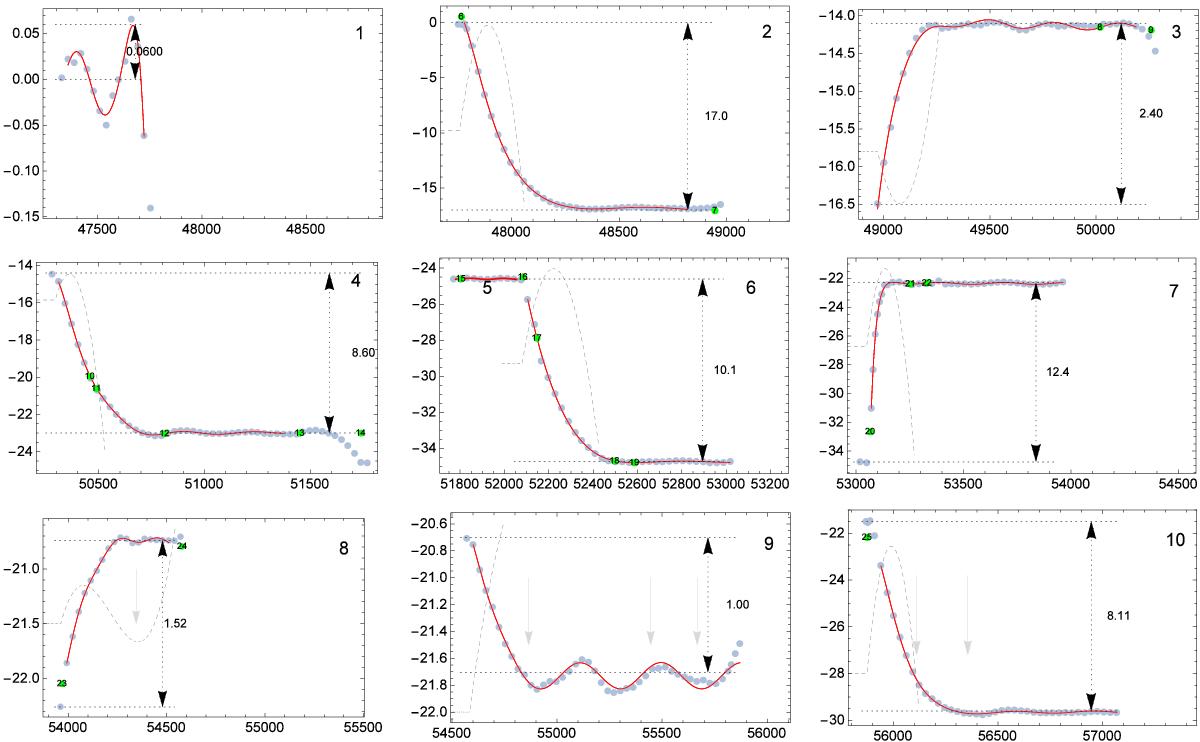
Sinusoidal phase functions Rj(t) (red lines) that fit the JBE phase residuals (blue points) for episodes from j = 1 to 10 (the short episode 5 is included in the graph showing episode 6). Time on the abscissa is in MJD, and the scale is the same for all episodes. Green dots are numbered as in Espinoza et al. (2011) at dates of published glitches with the ordinate as calculated from Rj(t). Ordinate scales are different and adjusted to different amplitudes of oscillations. Each panel shows data of the complete episode and includes the first point of the next episode. The difference between horizontal dotted lines represents a measure of the strength of the perturbation Rj(t) caused by the glitch. Dashed gray curves are the plots of ϕj(t)−ϕj−1(t), to show the difference of phases between two contiguous episodes. Gray arrows point to dates of the > 100 MeV X-ray flares detected by Fermi (Abdo et al. 2011; Ojiha et al. 2013; Bühler et al. 2012) and AGILE (Tavani et al. 2011; Striani et al. 2013).
Current usage metrics show cumulative count of Article Views (full-text article views including HTML views, PDF and ePub downloads, according to the available data) and Abstracts Views on Vision4Press platform.
Data correspond to usage on the plateform after 2015. The current usage metrics is available 48-96 hours after online publication and is updated daily on week days.
Initial download of the metrics may take a while.