Fig. 5
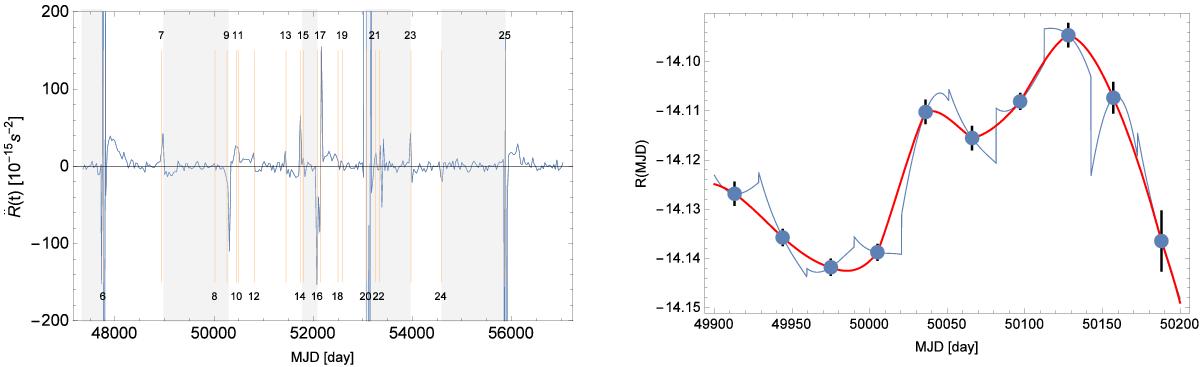
Left: second time derivative of the residual phase Rs(t), a third-order spline fit through phase residuals from Table T. The orange vertical lines are drawn at dates of reported glitches and labeled according to Table A.1. Episodes are shaded intermittently as light gray and white. Right: phase residuals as a function of time for a short interval during episode 3. The red line shows Rs(t), while the blue line is calculated as suggested by explanatory notes of JBE (see text for details). Error bars show JBE quoted arrival-time uncertainties.
Current usage metrics show cumulative count of Article Views (full-text article views including HTML views, PDF and ePub downloads, according to the available data) and Abstracts Views on Vision4Press platform.
Data correspond to usage on the plateform after 2015. The current usage metrics is available 48-96 hours after online publication and is updated daily on week days.
Initial download of the metrics may take a while.