Fig. 4
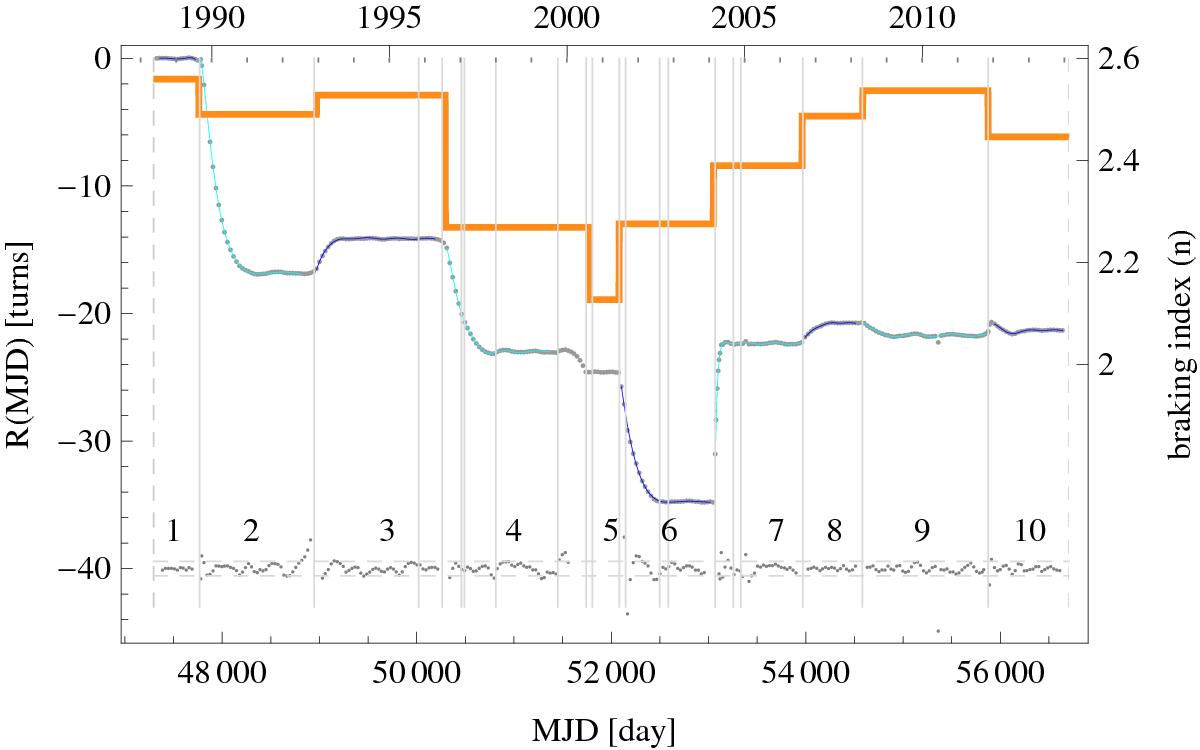
JBE phase residuals R(t) with respect to local fits ϕj(t) calculated for the 10 chosen episodes (see Fig. 3). Gray vertical lines are plotted at the dates of reported glitches (Espinoza et al. 2011). The braking index during episodes is shown in orange. Sinusoidal fits to residuals, discussed below, are shown in blue and cyan to distinguish episodes. Gray points at the bottom show ten times the difference between R(t) and sinusoidal fits Rj(t) at data points; the horizontal dashed lines bracket these final residuals with their standard deviation of 0.057 turns; the distribution of final residuals has wider wings than a Gaussian.
Current usage metrics show cumulative count of Article Views (full-text article views including HTML views, PDF and ePub downloads, according to the available data) and Abstracts Views on Vision4Press platform.
Data correspond to usage on the plateform after 2015. The current usage metrics is available 48-96 hours after online publication and is updated daily on week days.
Initial download of the metrics may take a while.