Fig. 3
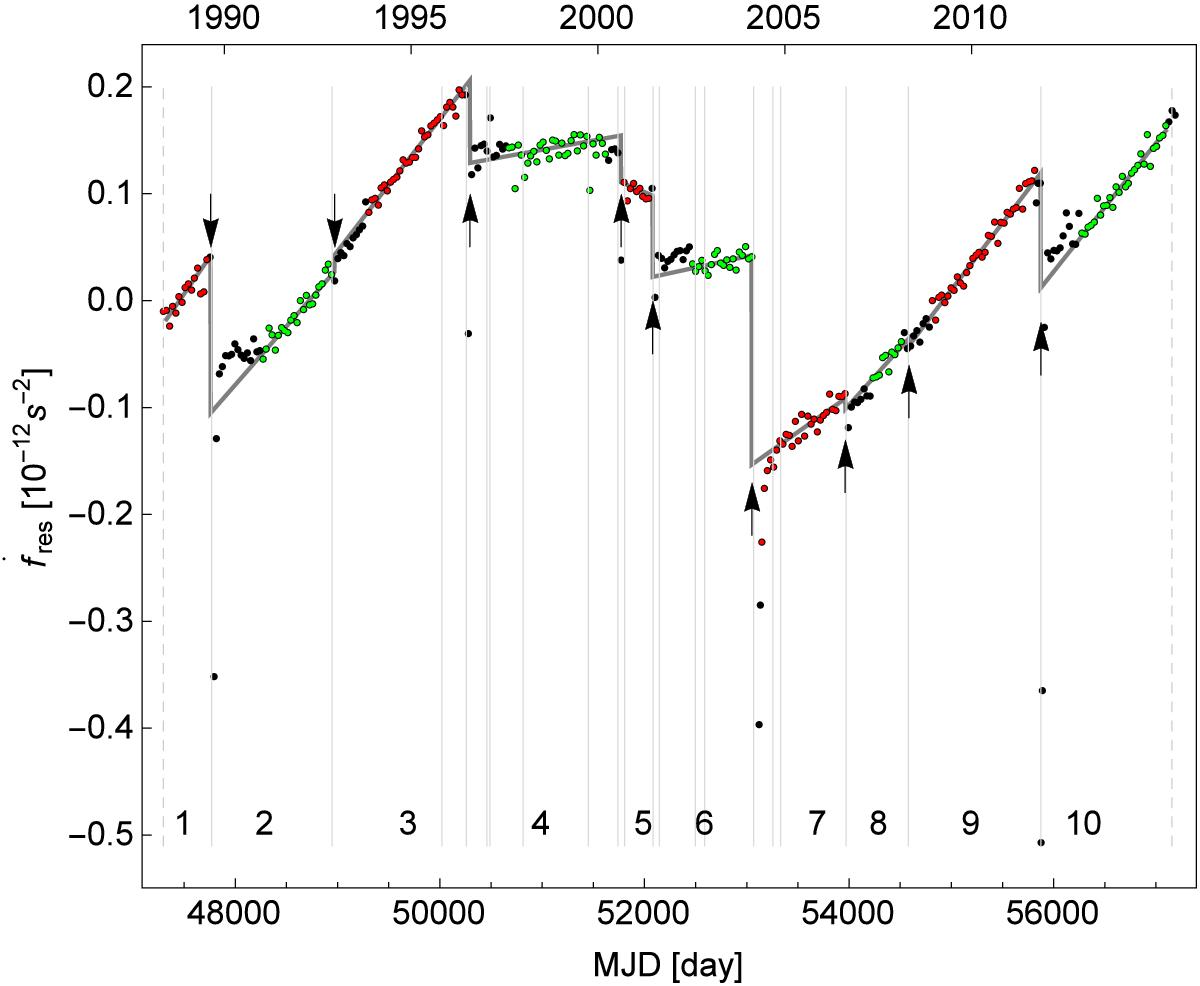
Residuals of JBE frequency derivatives with respect to a constant braking index law fit with n = 2.5, calculated over the whole JBE interval (from 1988 May through 2015 June 15th). The vertical gray lines denote the occurrence of glitches as reported by Espinoza et al. (2011)2 (see Table A.1). Nine arrows delimit chosen episodes and are placed at times when (major) glitches appear to change the braking index. The two dashed vertical lines mark the beginning and the end of the data set. The gray broken line indicates the second derivative of the continuous phase function defined in the text. Points used for the fit with the braking law model ϕj(t) are displayed in red and green, while points in black are excluded from the fit, as explained in the text. Some post glitch residuals with the value below −0.5 × 10⁻¹² s-2 go beyond the scale and are not shown.
Current usage metrics show cumulative count of Article Views (full-text article views including HTML views, PDF and ePub downloads, according to the available data) and Abstracts Views on Vision4Press platform.
Data correspond to usage on the plateform after 2015. The current usage metrics is available 48-96 hours after online publication and is updated daily on week days.
Initial download of the metrics may take a while.