Free Access
Fig. 2
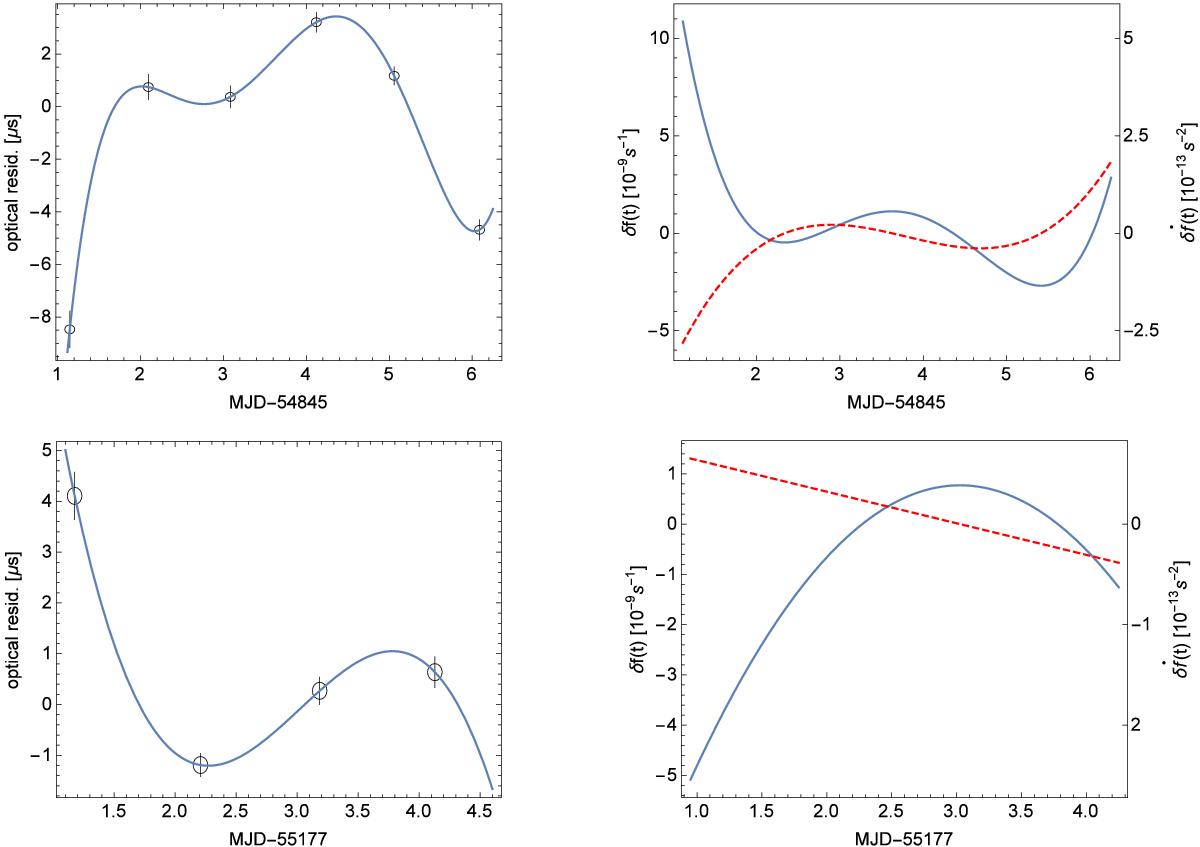
January (top) and December (bottom) 2009 optical residuals (Fig. 1) fitted to polynomials that reveal “typical” noise in pulsar frequency and frequency derivative, as shown on the right, in solid line for frequency residuals (left scale) and dashed for frequency derivative residuals (right scale).
Current usage metrics show cumulative count of Article Views (full-text article views including HTML views, PDF and ePub downloads, according to the available data) and Abstracts Views on Vision4Press platform.
Data correspond to usage on the plateform after 2015. The current usage metrics is available 48-96 hours after online publication and is updated daily on week days.
Initial download of the metrics may take a while.