Fig. 1
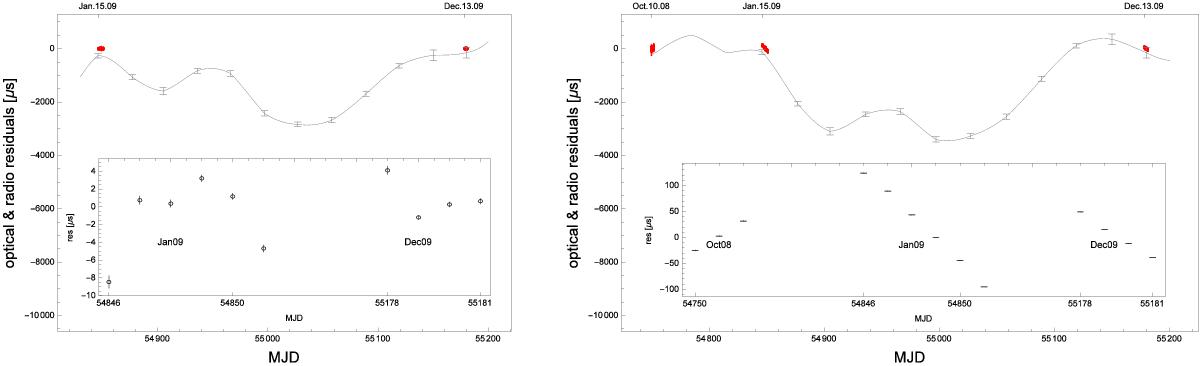
Residuals of optical and radio phase with respect to a BIM model. Left: best-fitting BIM to 2009 Iqueye data (n = 2.437). Right: best-fitting BIM to 2008−2009 Aqueye and Iqueye data (n = 2.476). Optical residuals are plotted as red data points clustered at the time of optical observations, while Jodrell Bank residuals (over the same interval of time) are represented by a gray line crossed by error bars at epoch dates of JBE. Insets: zoom of average optical phase residuals during observation nights with 1σ error bars. The scales of the y-axis in the insets are very different.
Current usage metrics show cumulative count of Article Views (full-text article views including HTML views, PDF and ePub downloads, according to the available data) and Abstracts Views on Vision4Press platform.
Data correspond to usage on the plateform after 2015. The current usage metrics is available 48-96 hours after online publication and is updated daily on week days.
Initial download of the metrics may take a while.