| Issue |
A&A
Volume 587, March 2016
|
|
|---|---|---|
| Article Number | C2 | |
| Number of page(s) | 1 | |
| Section | Interstellar and circumstellar matter | |
| DOI | https://doi.org/10.1051/0004-6361/201526467e | |
| Published online | 16 February 2016 | |
Impact of an inhomogeneous density distribution on selected observational characteristics of circumstellar disks (Corrigendum)
University of Kiel, Institute of Theoretical Physics and Astrophysics, Leibnizstrasse 15, 24118 Kiel, Germany
e-mail: This email address is being protected from spambots. You need JavaScript enabled to view it.
; This email address is being protected from spambots. You need JavaScript enabled to view it.
Key words: protoplanetary disks / circumstellar matter / stars: pre-main sequence / radiative transfer / dust, extinction / polarization / errata, addenda
In the legend of Fig. 7, the density contrast k needs to be 100 instead of 0.01. The x- and y-axis ticks of Figs. 8 and 10 need to be [0.3,0.5,0.7,0.8,0.95] for the mass ratio and [3.2,10,32,100] for the density contrast. However, these corrections have no influence on the results of this paper.
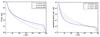 |
Fig. 7 Radial brightness profile (left) and its standard deviation (right) of the reference and two clumpy circumstellar disks. 50 concentric rings are used for the calculation of the brightness profile. (λ = 0.726 μm, i = 0°, Mdust = 10-6 M⊙, amin = 0.005 μm and amax = 0.25 μm) |
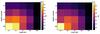 |
Fig. 8 Mean degree of polarization (left) and its standard deviation (right) dependent on mass ratio and density contrast. Each configuration is simulated with 100 different positions of clumps. (λ = 0.726 μm, i = 0°, Mdust = 10-6 M⊙, amin = 0.005 μm and amax = 0.25 μm) |
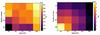 |
Fig. 10 Mean degree of polarization (left) and its standard deviation (right) dependent on mass ratio and density contrast. Each configuration is simulated with 100 different positions of clumps. (λ = 0.726 μm, i = 45°, Mdust = 10-6 M⊙, amin = 0.005 μm and amax = 0.25 μm) |
© ESO, 2016
Current usage metrics show cumulative count of Article Views (full-text article views including HTML views, PDF and ePub downloads, according to the available data) and Abstracts Views on Vision4Press platform.
Data correspond to usage on the plateform after 2015. The current usage metrics is available 48-96 hours after online publication and is updated daily on week days.
Initial download of the metrics may take a while.