Free Access
Fig. 18
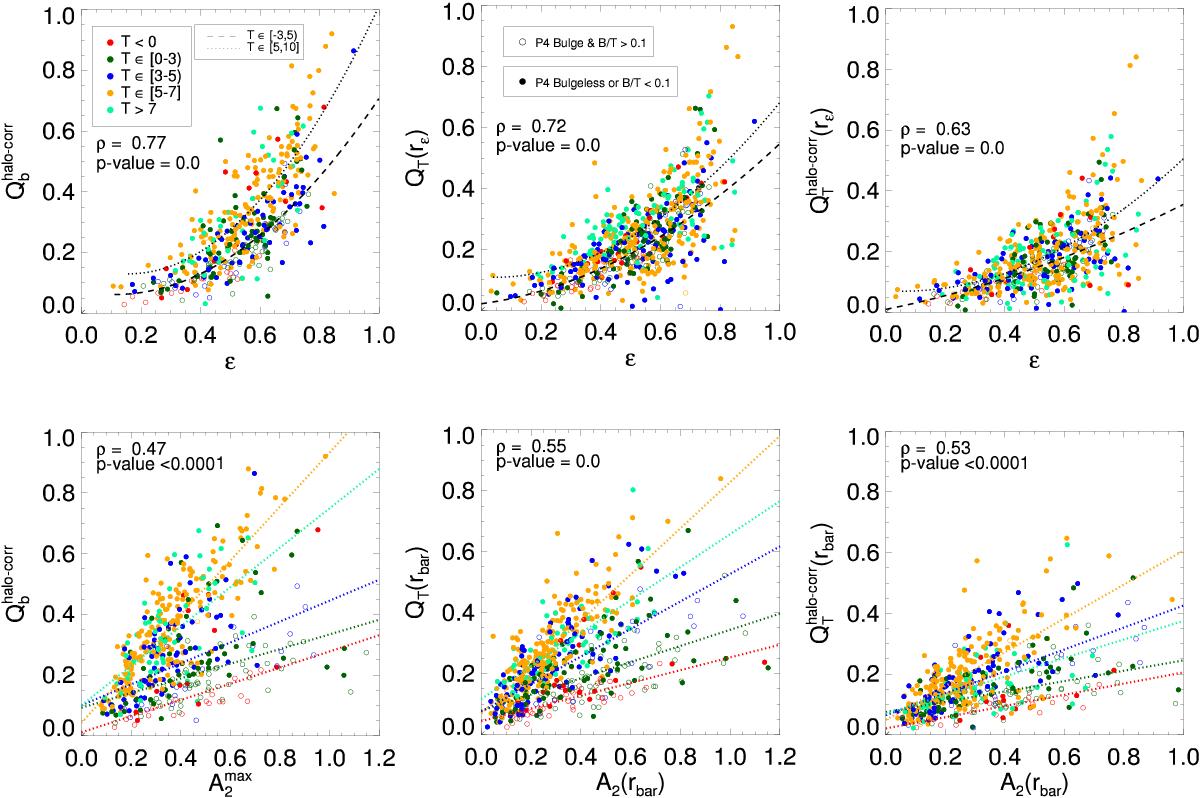
Same as in Fig. 17, but using the halo-corrected values of Qb and also the forces evaluated at the bar end (rbar). The same colour palette and symbols are used as in the previous plots. The Spearman’s rank correlation coefficient and significance of the relation for different T bins are displayed in Table 4.
Current usage metrics show cumulative count of Article Views (full-text article views including HTML views, PDF and ePub downloads, according to the available data) and Abstracts Views on Vision4Press platform.
Data correspond to usage on the plateform after 2015. The current usage metrics is available 48-96 hours after online publication and is updated daily on week days.
Initial download of the metrics may take a while.