Fig. 12
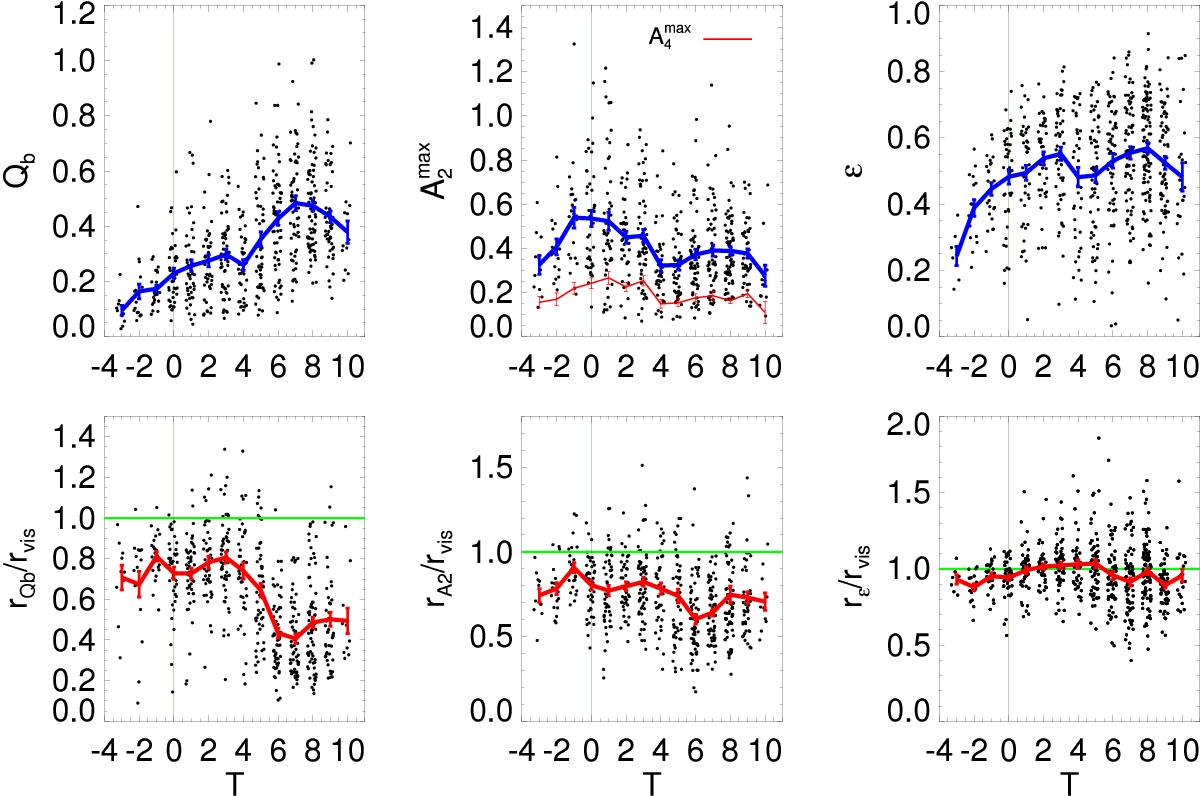
Different bar strength indicators as a function of the Hubble Type. Upper row: the Qb, ![]() ,
, ![]() and ε are plotted vs. the integer value of the revised numerical Hubble stage (from left to right, respectively). Lower row: radius of maximum gravitational torque, Fourier amplitude and ellipticity, normalized to the visual estimate of the bar length as a function of the Hubble stage. The running mean is overplotted with a solid line and the standard error of the mean is indicated with a vertical error bar. T values in the x-axis (integers) have been randomly displaced for the sake of avoiding point overlapping. For all the plots, the green vertical line demarcates the region of S0 galaxies. In the central upper panel, the moving average of bar maximum amplitude of the m = 4 Fourier component (
and ε are plotted vs. the integer value of the revised numerical Hubble stage (from left to right, respectively). Lower row: radius of maximum gravitational torque, Fourier amplitude and ellipticity, normalized to the visual estimate of the bar length as a function of the Hubble stage. The running mean is overplotted with a solid line and the standard error of the mean is indicated with a vertical error bar. T values in the x-axis (integers) have been randomly displaced for the sake of avoiding point overlapping. For all the plots, the green vertical line demarcates the region of S0 galaxies. In the central upper panel, the moving average of bar maximum amplitude of the m = 4 Fourier component (![]() ) is also displayed.
) is also displayed.
Current usage metrics show cumulative count of Article Views (full-text article views including HTML views, PDF and ePub downloads, according to the available data) and Abstracts Views on Vision4Press platform.
Data correspond to usage on the plateform after 2015. The current usage metrics is available 48-96 hours after online publication and is updated daily on week days.
Initial download of the metrics may take a while.