Fig. 5
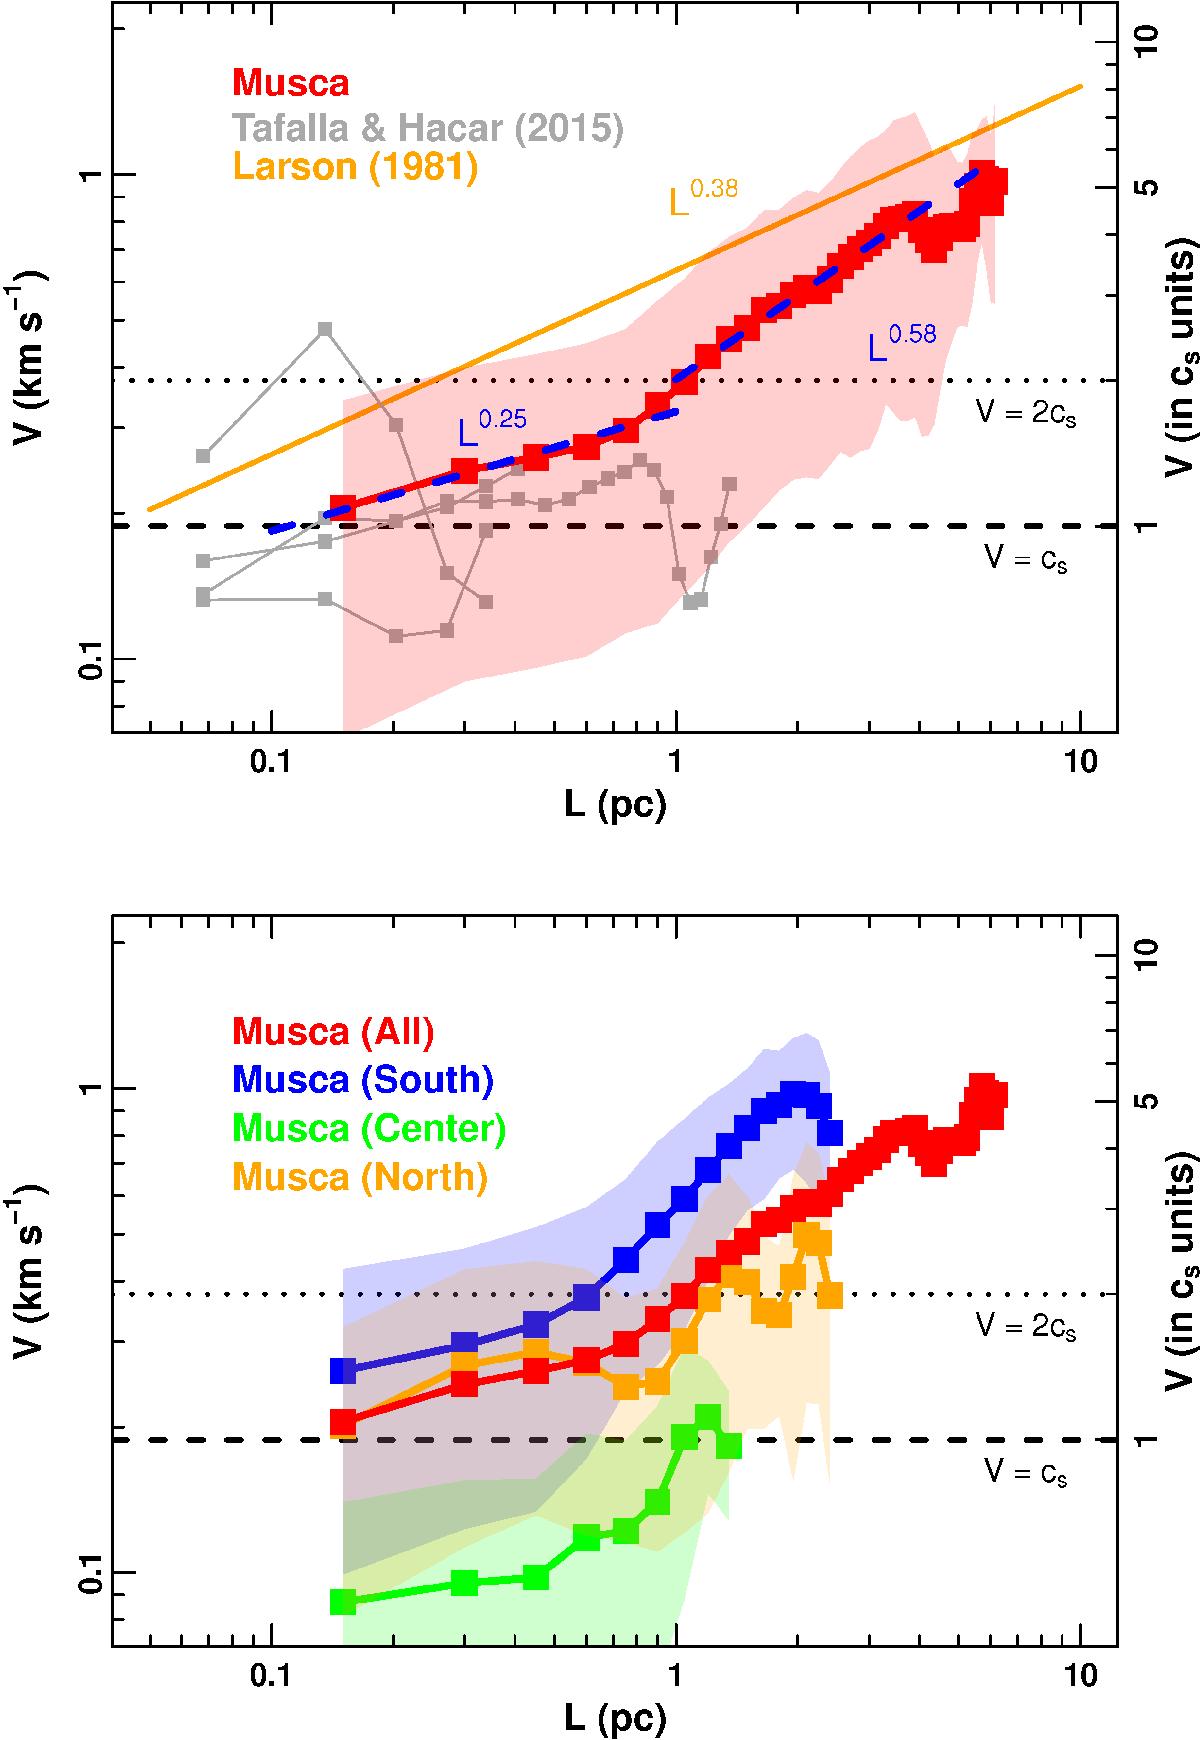
Second-order structure function in velocity S2(L)1 / 2 = δV as a function of length L (i.e. lag) derived from our 13CO observations along the main axis of Musca (red points). Upper panel: analysis of the global velocity field within the Musca filament. For comparison, the results obtained by Tafalla & Hacar (2015) in four distinct velocity-coherent fibers in the B213-L1495 cloud are displayed in gray. The orange line denotes the Larson’s velocity dispersion-size relationship with δV = σ = 0.63 L0.38. Lower panel: structure function of the individual south (blue), center (green), and north (orange) subregions within Musca (see text) in comparison with the total cloud (red; similar to upper panel). The errors on the δV measurements are smaller than the point size. Instead, the shaded areas refer to the intrinsic dispersion of these measurements created by the combined contribution of the velocity excursions with different periods and the variations of the large-scale velocity gradients within this filament (see text).
Current usage metrics show cumulative count of Article Views (full-text article views including HTML views, PDF and ePub downloads, according to the available data) and Abstracts Views on Vision4Press platform.
Data correspond to usage on the plateform after 2015. The current usage metrics is available 48-96 hours after online publication and is updated daily on week days.
Initial download of the metrics may take a while.