Fig. 3
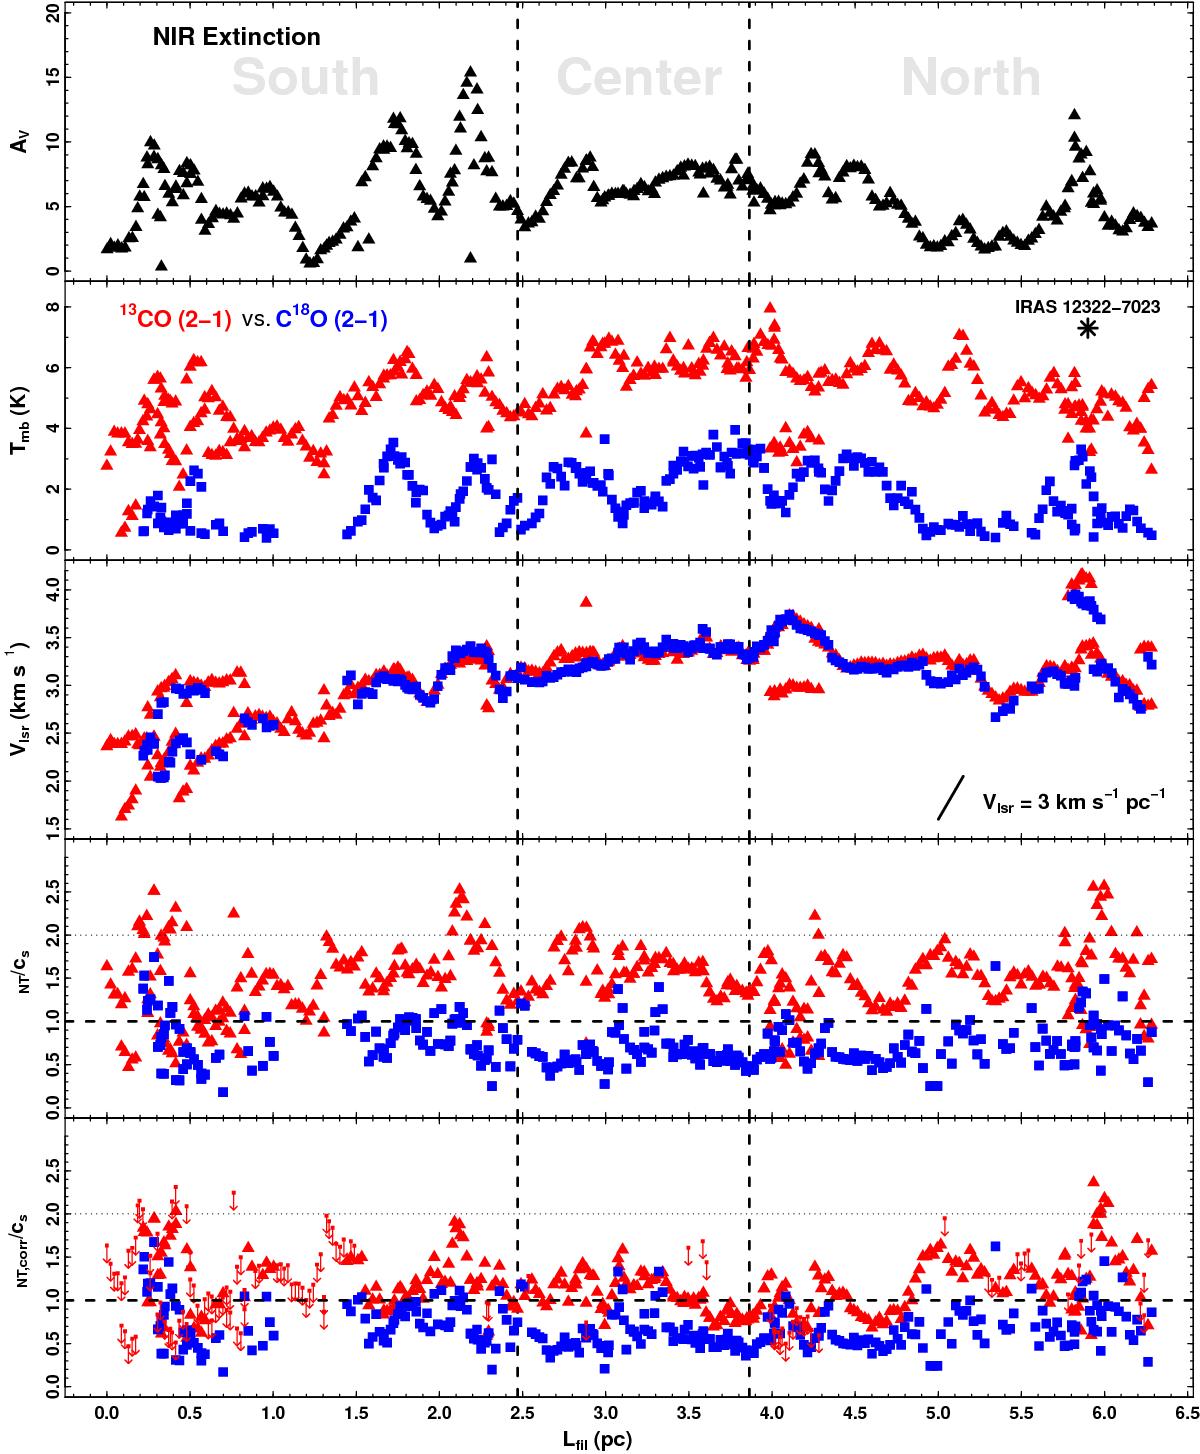
Observational results combining both NIR extinction (black) and both 13CO (red triangles) plus C18O (blue squares) (2−1) line measurements along the main axis of Musca. From top to bottom: (1) extinction profile obtained by Kainulainen et al. (2016); (2) CO main-beam brightness temperatures (Tmb); (3) centroid velocity (Vlsr); (4) non-thermal velocity dispersion along the line of sight (σNT); and (5) opacity corrected non-thermal velocity dispersion along the line of sight (σNT,corr) including upper limits for the 13CO emission (red arrows; see text for discussion). The velocity dispersion measurements are expressed in units of the sound speed cs = 0.19 km s-1 at 10 K. In these last plots the horizontal lines delimitate to the sonic (σNT/cs ≤ 1; thick dashed line) and transonic (σNT/cs ≤ 2; thin dotted line) regimes, respectively. Only those components with a S/N ≥ 3 are displayed in the plot. The position of the IRAS 12322-7023 source as well as a typical 3 km s-1 pc-1 velocity gradient are indicated in their corresponding panels. We note the presence of the double-peaked spectra at the positions Lfil ~ 0.4,4.2, and 5.8 pc in the middle panel. The two vertical lines delimitate the south, central, and north subregions identified by Kainulainen et al. (2016).
Current usage metrics show cumulative count of Article Views (full-text article views including HTML views, PDF and ePub downloads, according to the available data) and Abstracts Views on Vision4Press platform.
Data correspond to usage on the plateform after 2015. The current usage metrics is available 48-96 hours after online publication and is updated daily on week days.
Initial download of the metrics may take a while.