Fig. 2
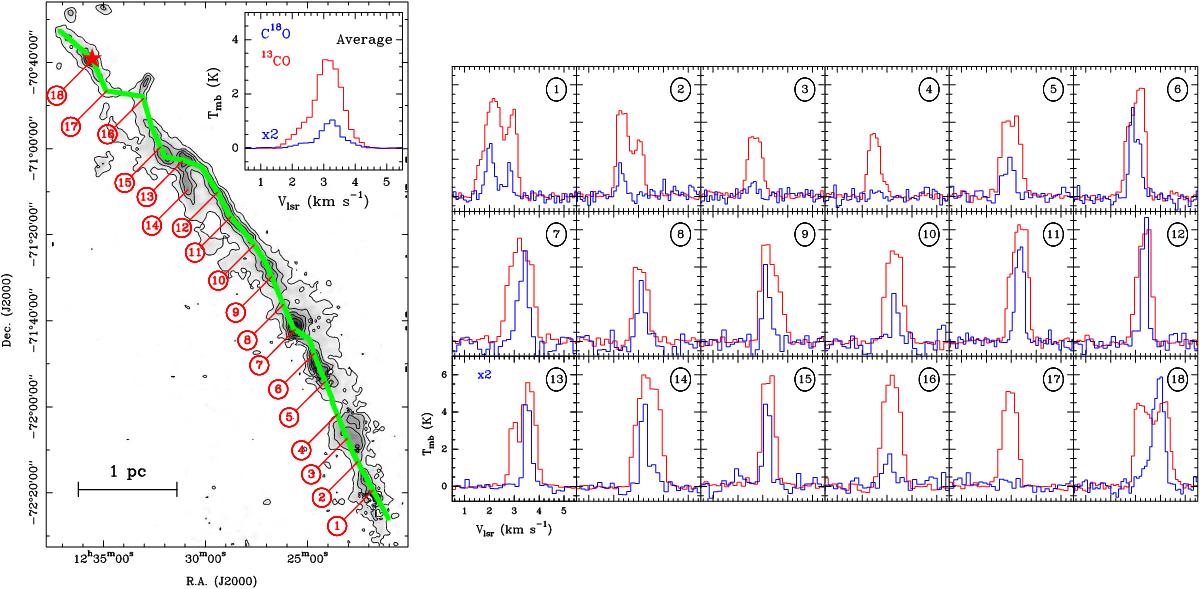
Left: total column density map derived from NIR extinction measurements (Kainulainen et al. 2016). The contours are equally spaced every 2 mag in AV. The 300 positions surveyed by our APEX observations in both the 13CO and C18O (2–1) lines are marked in green following the main axis of this filament. The red star in the upper left corner denotes the position of the TTauri IRAS12322-7023 source. Right: 13CO (2−1) (red) and C18O (2−1) (blue; multiplied by 2) line profiles found in different representative positions along this cloud (spectra 1−18), all labeled on the map. The averaged spectra of all the data available inside this region are also shown in the upper right corner of the extinction map.
Current usage metrics show cumulative count of Article Views (full-text article views including HTML views, PDF and ePub downloads, according to the available data) and Abstracts Views on Vision4Press platform.
Data correspond to usage on the plateform after 2015. The current usage metrics is available 48-96 hours after online publication and is updated daily on week days.
Initial download of the metrics may take a while.