Fig. 9
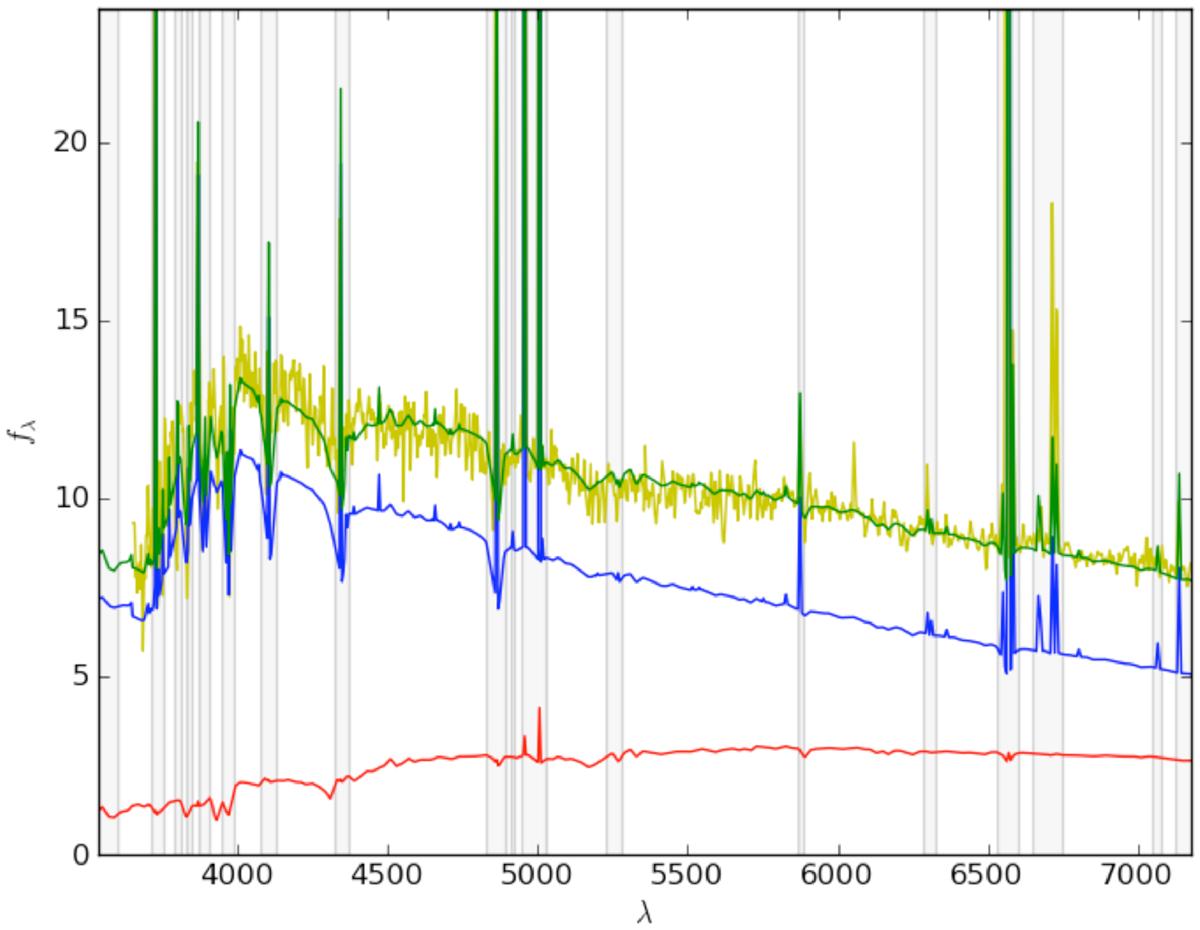
An example of a model of a starburst spectrum (SDSS SpecObjId 81288133269782528). Displayed are the two model components – a young (blue line) and an old (red line) stellar population. The sum of the model spectra (dark green line) is shown on top of the observed spectrum (light green). The observed spectrum has been smoothed with a triangular filter with a width of 7 pixels. The shaded areas indicate regions we have flagged to avoid strong emission lines in the fits. Note however that EWHα,em is used as a separate criterion in the fitting.
Current usage metrics show cumulative count of Article Views (full-text article views including HTML views, PDF and ePub downloads, according to the available data) and Abstracts Views on Vision4Press platform.
Data correspond to usage on the plateform after 2015. The current usage metrics is available 48-96 hours after online publication and is updated daily on week days.
Initial download of the metrics may take a while.