Fig. A.8
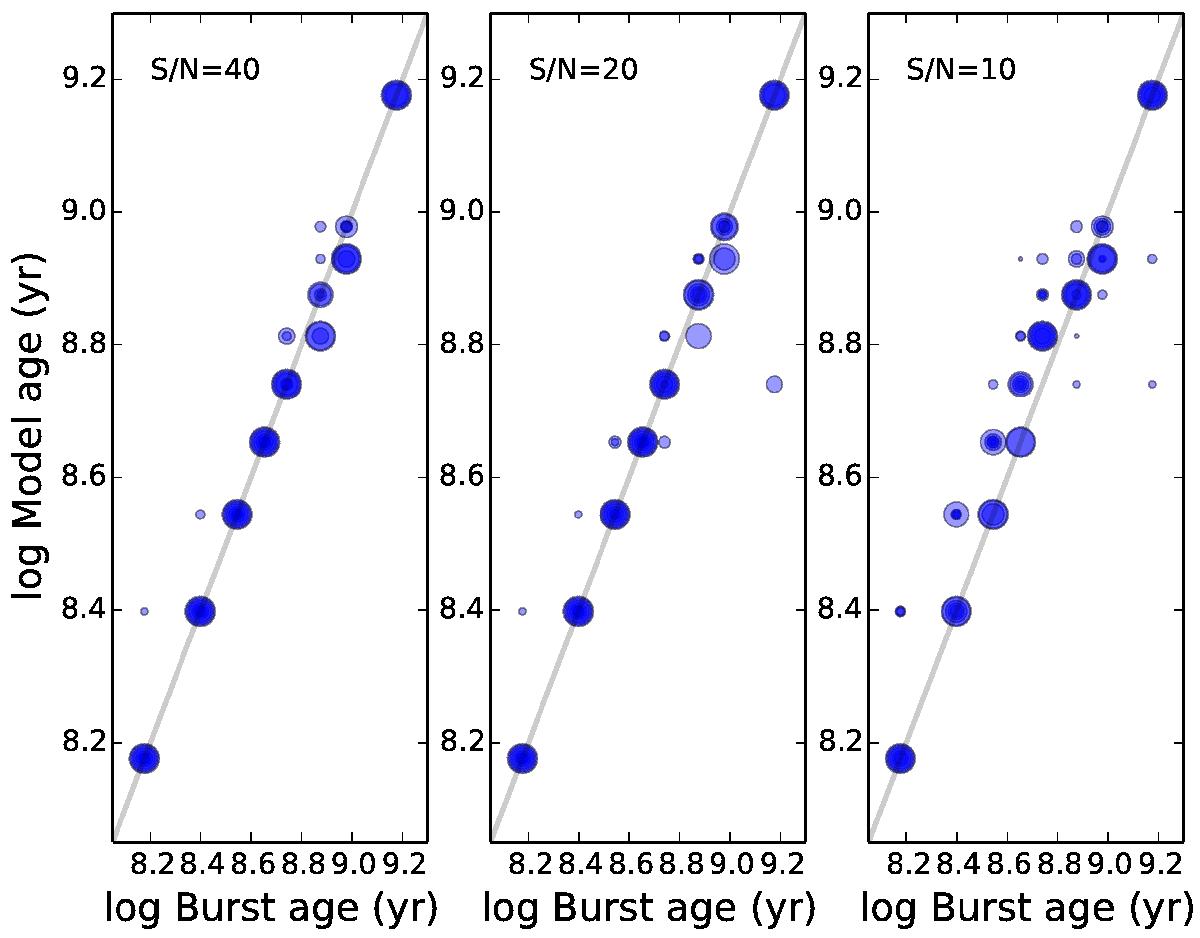
Test of the reliability of our determination of the ages of the postburst galaxies. We loaded our SEM with the same set of spectra described in the previous section applying 3 different S/N reductions. Each time step contains 10 spectra with different mass fractions between 2 and 100% as previously described. Larger symbols represent larger mass fractions.
Current usage metrics show cumulative count of Article Views (full-text article views including HTML views, PDF and ePub downloads, according to the available data) and Abstracts Views on Vision4Press platform.
Data correspond to usage on the plateform after 2015. The current usage metrics is available 48-96 hours after online publication and is updated daily on week days.
Initial download of the metrics may take a while.