Fig. A.7
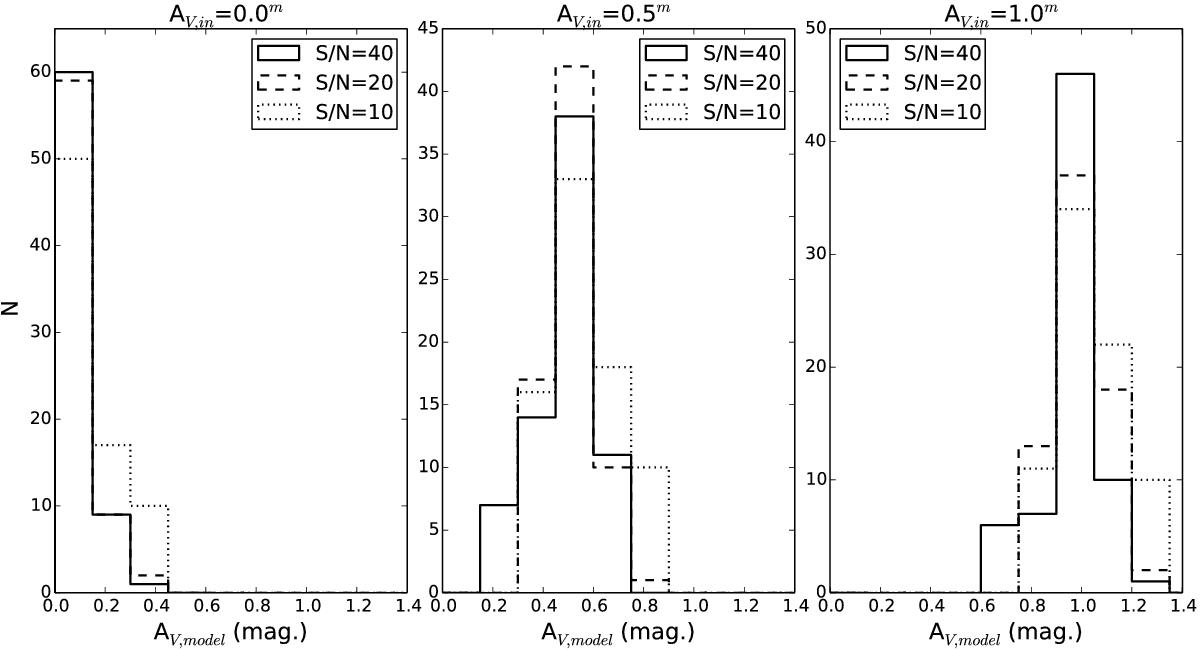
Test of the reliability of our determination of the dust attenuation in the V band (AV) based on a grid of 80 synthetic postburst spectra with ages 150, 250, 350, 450, 550, 750, 950 and 1500 Myr and mass fractions 2, 4, 6, 8, 10, 20, 40, 60, 80 and 100%. The preceding starburst was assumed to have constant SFR over 100 Myr. The old component was assumed to have an age of 10 Gyr. Both have 40% solar metallicity. To these spectra we added reddening corresponding to AV = 0, 0.5 and 1 mag as titles in the diagrams. We then degraded the spectra with Gaussian noise corresponding to the S/N per Å = 10, 20 and 40. Finally we used our SEM to derive AV from the noisy spectra, as shown on the abscissa. The result is displayed in the histograms with the number of spectra on the ordinate.
Current usage metrics show cumulative count of Article Views (full-text article views including HTML views, PDF and ePub downloads, according to the available data) and Abstracts Views on Vision4Press platform.
Data correspond to usage on the plateform after 2015. The current usage metrics is available 48-96 hours after online publication and is updated daily on week days.
Initial download of the metrics may take a while.