Fig. 4
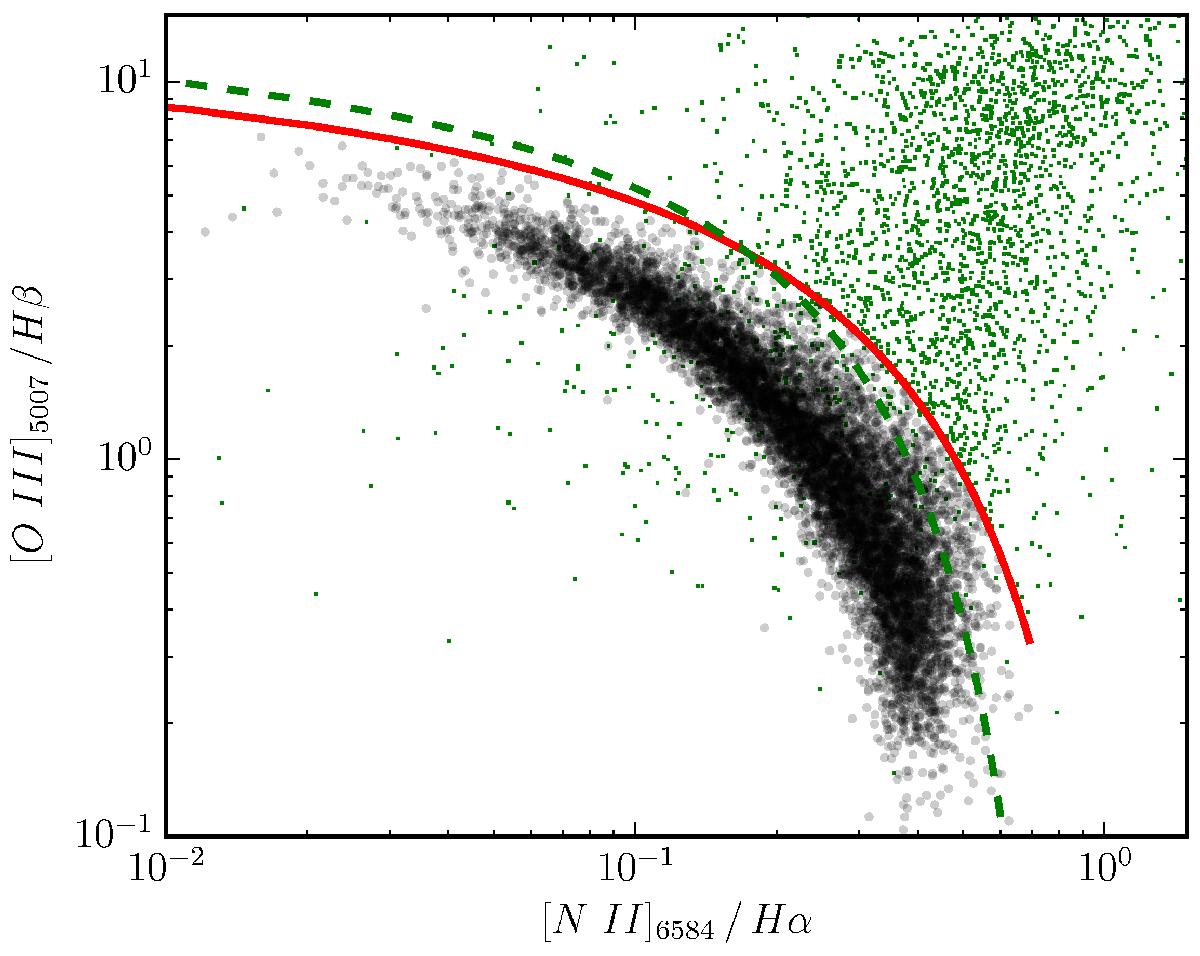
BPT (Baldwin et al. 1981) diagram of the EWHα≥ 60 Å starburst galaxy candidate sample based on line peak intensity ratios. The solid red line is the empirical dividing line (a modified version of the equation given by Kauffmann et al. (2003a) shown in hatched green) between starburst galaxies (lower part, grey symbols) and galaxies containing an AGN contributing significantly to the flux in the strong emission lines (upper part, green dots). As a complementary AGN criterion we also used FWHM(Hαem) > 540 km s-1.
Current usage metrics show cumulative count of Article Views (full-text article views including HTML views, PDF and ePub downloads, according to the available data) and Abstracts Views on Vision4Press platform.
Data correspond to usage on the plateform after 2015. The current usage metrics is available 48-96 hours after online publication and is updated daily on week days.
Initial download of the metrics may take a while.