Free Access
Fig. A.6
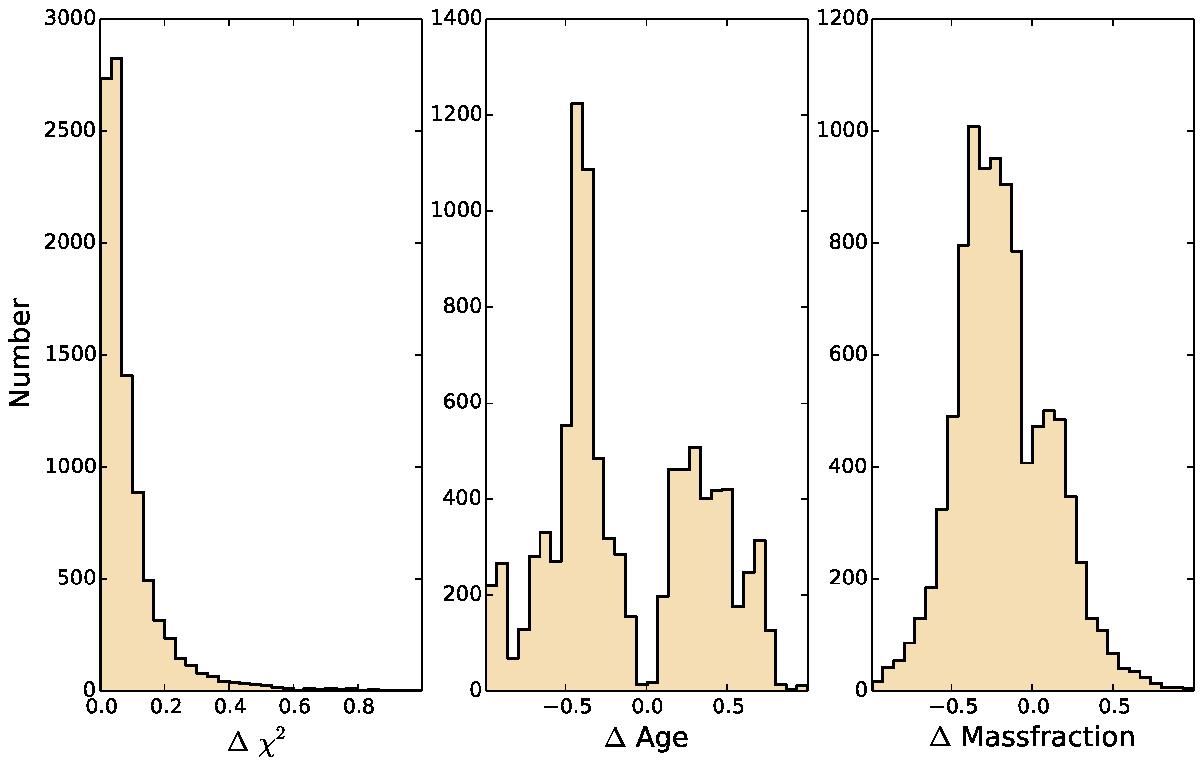
Illustration of how well the agreement between the best and worst spectral fits to a single SDSS spectrum agree as model metallicities, dust and star formation histories are allowed to vary. The histograms show the deviations in log of the ratio between the predicted parameter values of the worst and the best fits.
Current usage metrics show cumulative count of Article Views (full-text article views including HTML views, PDF and ePub downloads, according to the available data) and Abstracts Views on Vision4Press platform.
Data correspond to usage on the plateform after 2015. The current usage metrics is available 48-96 hours after online publication and is updated daily on week days.
Initial download of the metrics may take a while.