Fig. 33
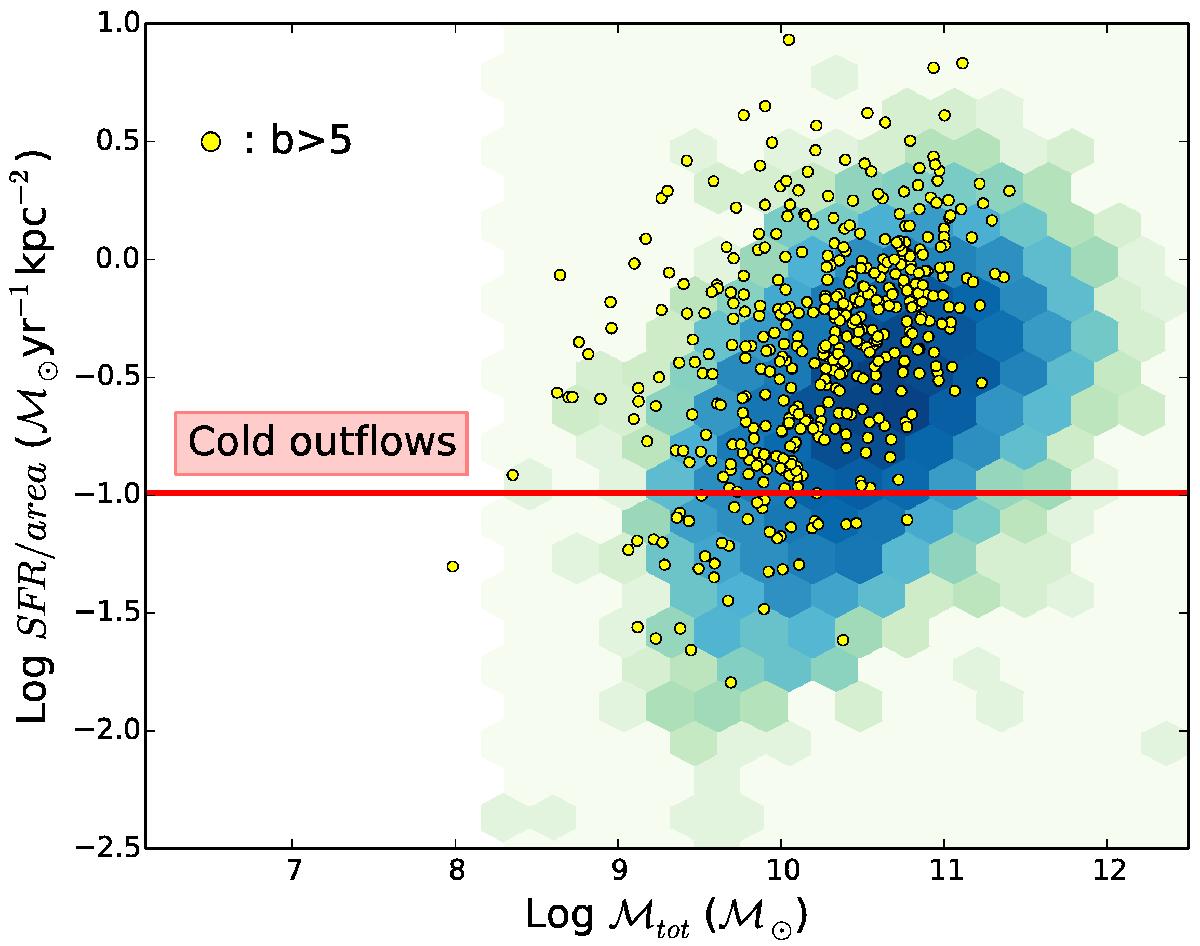
SFR per area as function of baryonic mass of the galaxies in the starburst candidate sample. Galaxies with b > 5 (yellow circles) are superposed on the distribution of the remaining galaxies (blue triangles). The horizontal line marks the transition between when the energy produced by the starburst is sufficient to generate outflows, both according to models and to observations.
Current usage metrics show cumulative count of Article Views (full-text article views including HTML views, PDF and ePub downloads, according to the available data) and Abstracts Views on Vision4Press platform.
Data correspond to usage on the plateform after 2015. The current usage metrics is available 48-96 hours after online publication and is updated daily on week days.
Initial download of the metrics may take a while.