Fig. 3
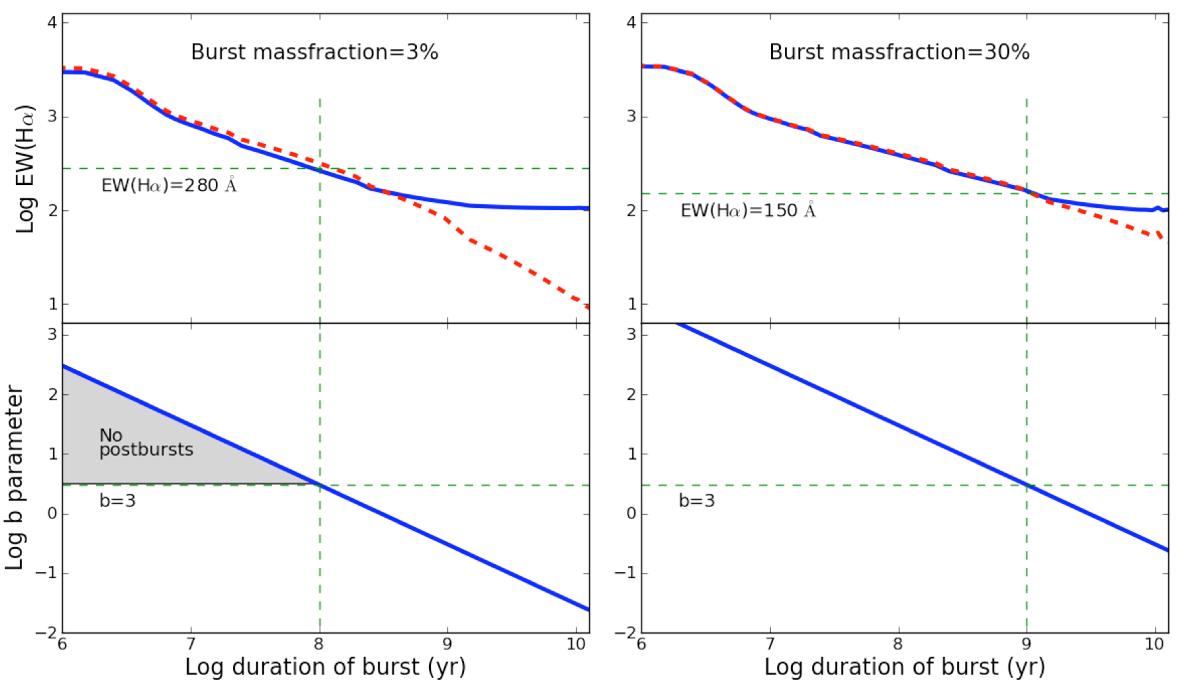
Upper diagrams: our model predictions of EWHα,em as function of the duration of the burst when 3 and 30% of the total mass is formed during a burst with constant SFR. Two different scenarios are displayed: 1) a burst in an old galaxy where the stars were formed in a single burst (hatched line); and 2) a burst in a galaxy which has had a constant SFR over a Hubble time (solid line). Lower diagrams: the evolution of the b-parameter. The limit of our criterion of a starburst, the soft criterion, stating that ![]() , is marked with the horizontal line in the lower diagrams. The blue inclined line corresponds to mass fractions of 3 and 30% respectively. The vertical lines indicate the maximum ages of a starburst with mass fractions 3 and 30% respectively, to fulfil the soft starburst criterion. The horizontal lines in the upper diagrams indicate EWHα,em at that burst duration and the corresponding EWHα,em in numbers are given below. The shaded area indicates a region containing starbursts according to the b-parameter criterion but which will not be powerful enough to produce postbursts according to the EWHδ,abs< −6 Å criterion.
, is marked with the horizontal line in the lower diagrams. The blue inclined line corresponds to mass fractions of 3 and 30% respectively. The vertical lines indicate the maximum ages of a starburst with mass fractions 3 and 30% respectively, to fulfil the soft starburst criterion. The horizontal lines in the upper diagrams indicate EWHα,em at that burst duration and the corresponding EWHα,em in numbers are given below. The shaded area indicates a region containing starbursts according to the b-parameter criterion but which will not be powerful enough to produce postbursts according to the EWHδ,abs< −6 Å criterion.
Current usage metrics show cumulative count of Article Views (full-text article views including HTML views, PDF and ePub downloads, according to the available data) and Abstracts Views on Vision4Press platform.
Data correspond to usage on the plateform after 2015. The current usage metrics is available 48-96 hours after online publication and is updated daily on week days.
Initial download of the metrics may take a while.