Free Access
Fig. 24
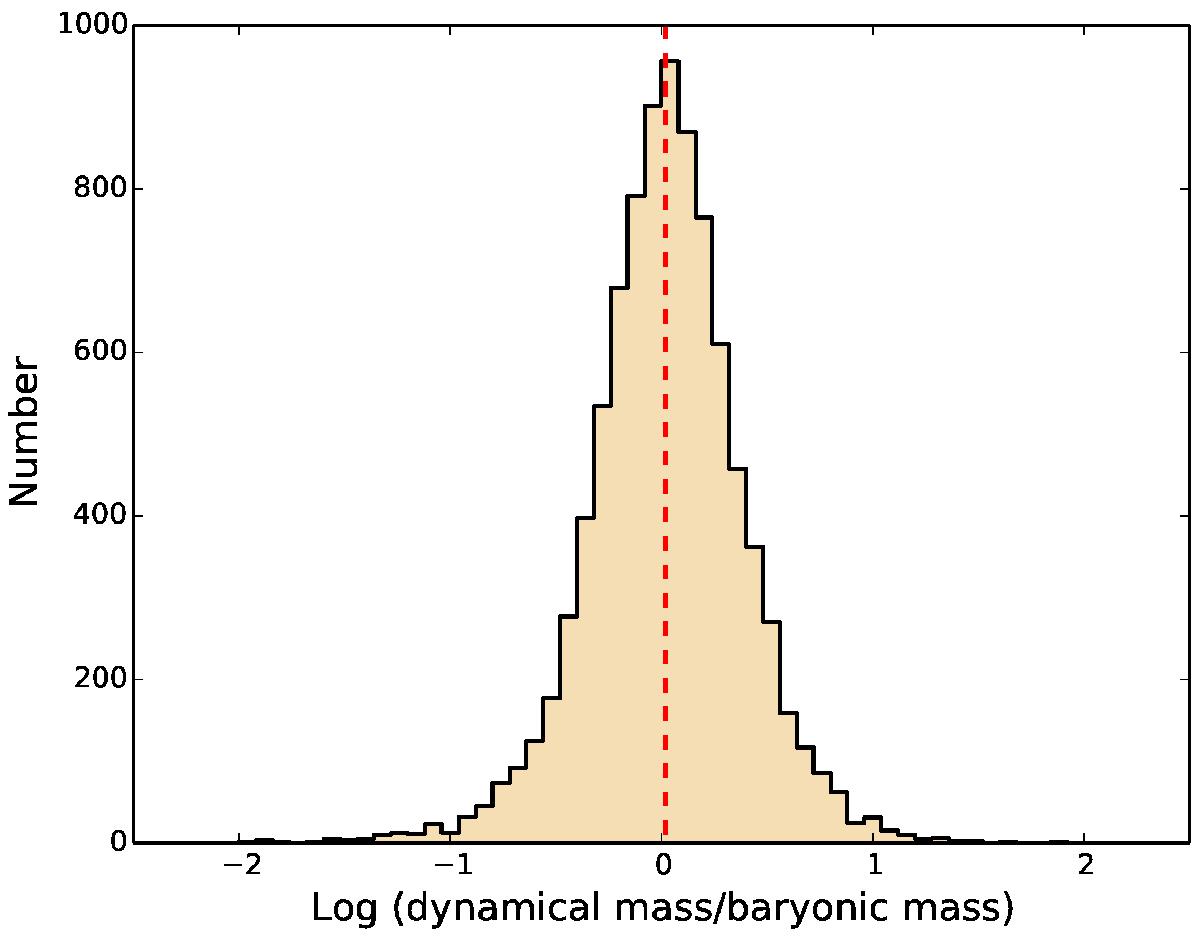
Histogram of the ratio between the dynamical and baryonic (stars+gas) masses inside the fiber aperture. The dynamical masses are based on the disc approximation. The hatched vertical line is the median.
Current usage metrics show cumulative count of Article Views (full-text article views including HTML views, PDF and ePub downloads, according to the available data) and Abstracts Views on Vision4Press platform.
Data correspond to usage on the plateform after 2015. The current usage metrics is available 48-96 hours after online publication and is updated daily on week days.
Initial download of the metrics may take a while.