Fig. 22
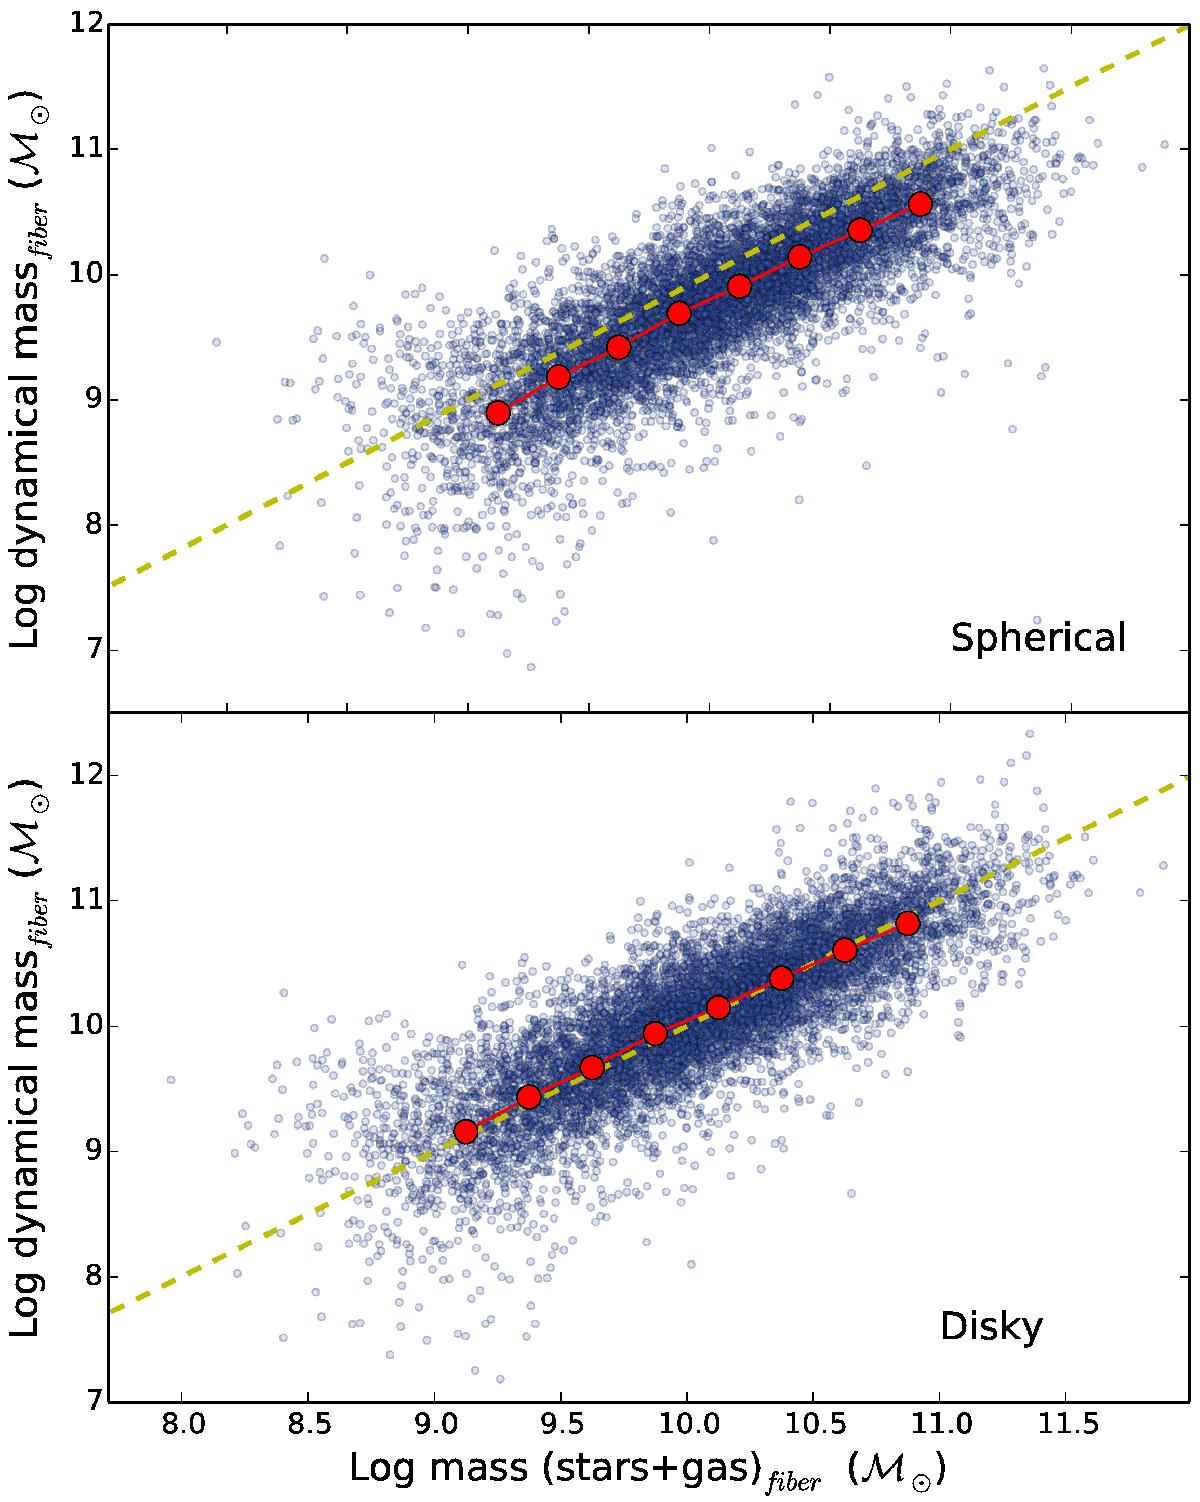
Dynamical mass, derived from the width of the Hα emission line versus the baryonic mass (stars+gas), derived from the spectral fit. The two diagrams display the results emerging from two different assumptions about the kinematics of the Hα emitting gas. In the spherical case it is assumed that virial motions take place in a spherically symmetric structure and in the disc case it is assumed that the gas clouds move in circular orbits in a disk. Overplotted circles are the median values after binning along the x-axis. The hatched line marks the 1:1 relation.
Current usage metrics show cumulative count of Article Views (full-text article views including HTML views, PDF and ePub downloads, according to the available data) and Abstracts Views on Vision4Press platform.
Data correspond to usage on the plateform after 2015. The current usage metrics is available 48-96 hours after online publication and is updated daily on week days.
Initial download of the metrics may take a while.