Fig. 19
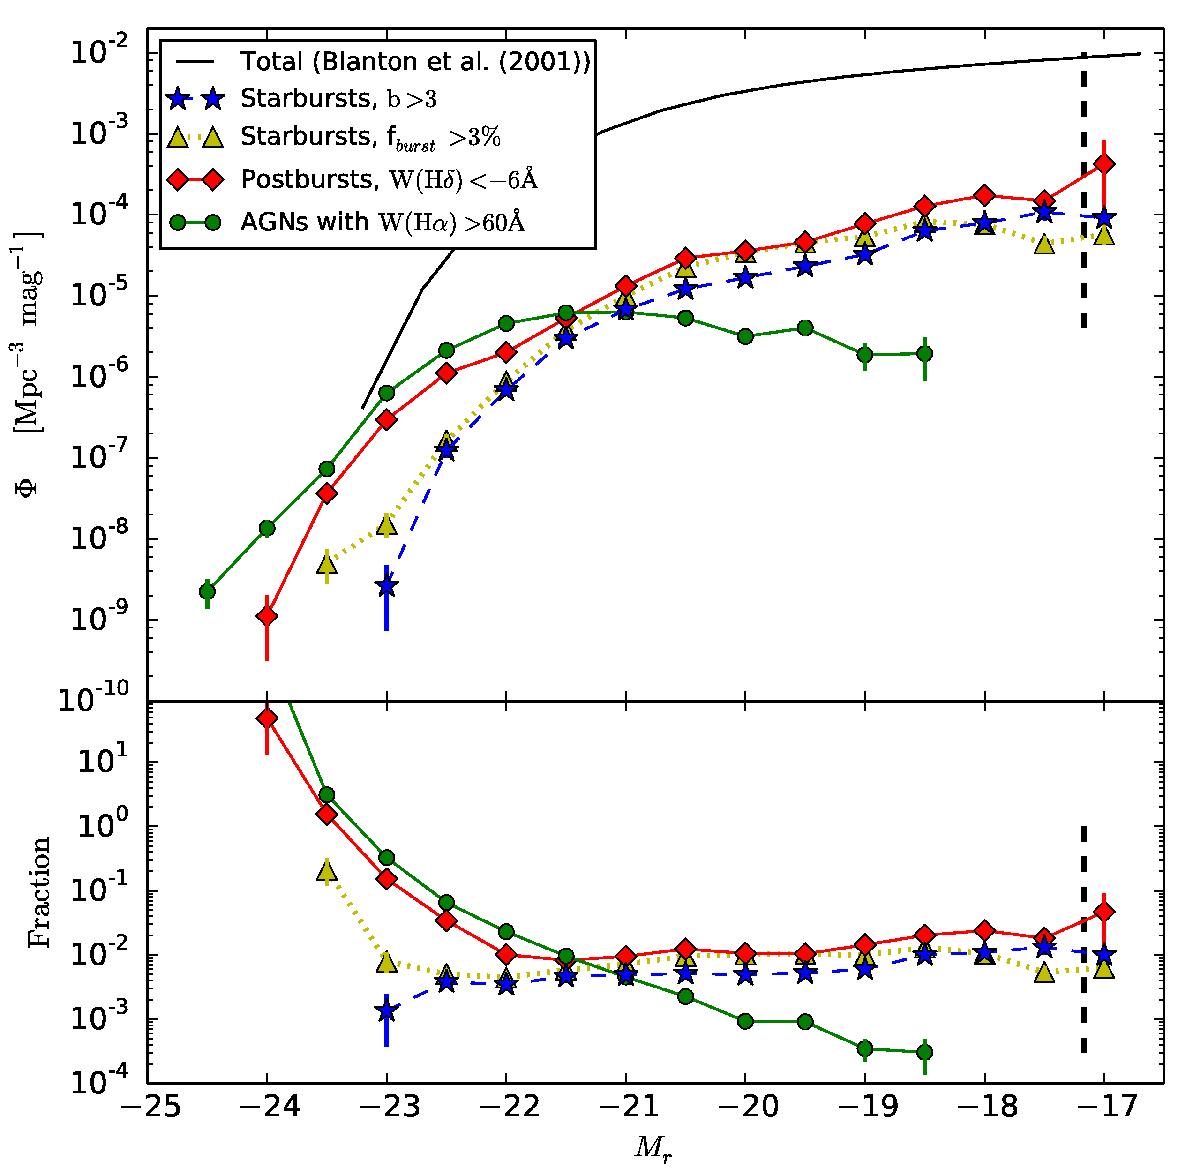
Upper diagram: LF of 1) starburst galaxies with a birthrate parameter b > 3; 2) starburst galaxies with a mass fraction of the burst fburst > 3%; 3) postburst galaxies; 4) AGNs in the emission-line galaxy sample; 5) the full galaxy LF of the local universe as derived by Blanton et al. (2001). The sampling completeness limit based on the apparent spectroscopic limit Mr = 17.5 and the redshift limit z = 0.02 is indicated with a vertical hatched line. Lower diagram: the relative fraction of the different samples with regards to the total LF, as a function of absolute magnitude. The vertical bars are standard deviations. Please notice that we have assumed (for purely technical reasons) that the Blanton LF for normal galaxies can be extrapolated to Mr < −23.
Current usage metrics show cumulative count of Article Views (full-text article views including HTML views, PDF and ePub downloads, according to the available data) and Abstracts Views on Vision4Press platform.
Data correspond to usage on the plateform after 2015. The current usage metrics is available 48-96 hours after online publication and is updated daily on week days.
Initial download of the metrics may take a while.