Free Access
Fig. 16
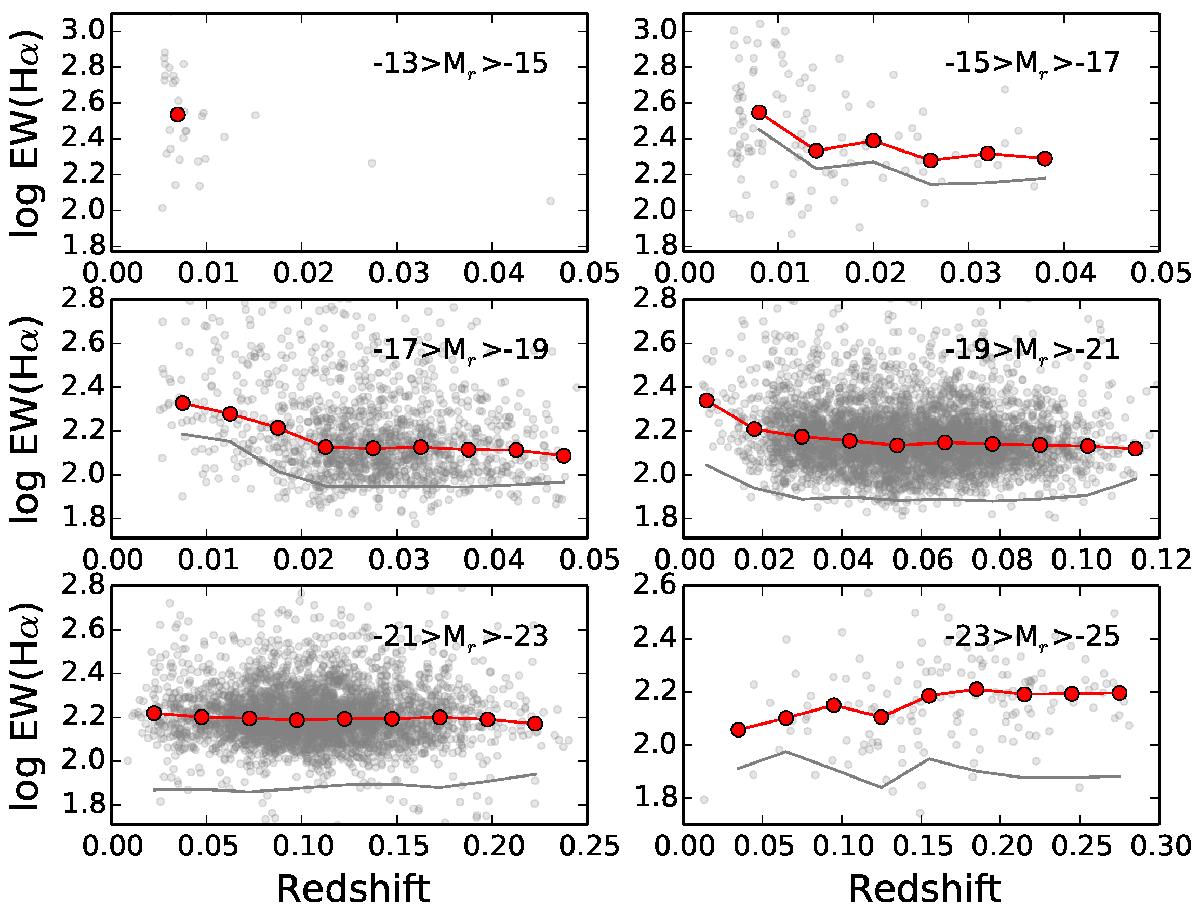
EWHα versus redshift in different luminosity bins after remeasurements and correction for dust attenuation. The red solid line shows the medians of log (EWHα) in bins along the x-axis. For comparison, the faint gray line shows the medians before corrections for dust attenuation.
Current usage metrics show cumulative count of Article Views (full-text article views including HTML views, PDF and ePub downloads, according to the available data) and Abstracts Views on Vision4Press platform.
Data correspond to usage on the plateform after 2015. The current usage metrics is available 48-96 hours after online publication and is updated daily on week days.
Initial download of the metrics may take a while.