Fig. 11
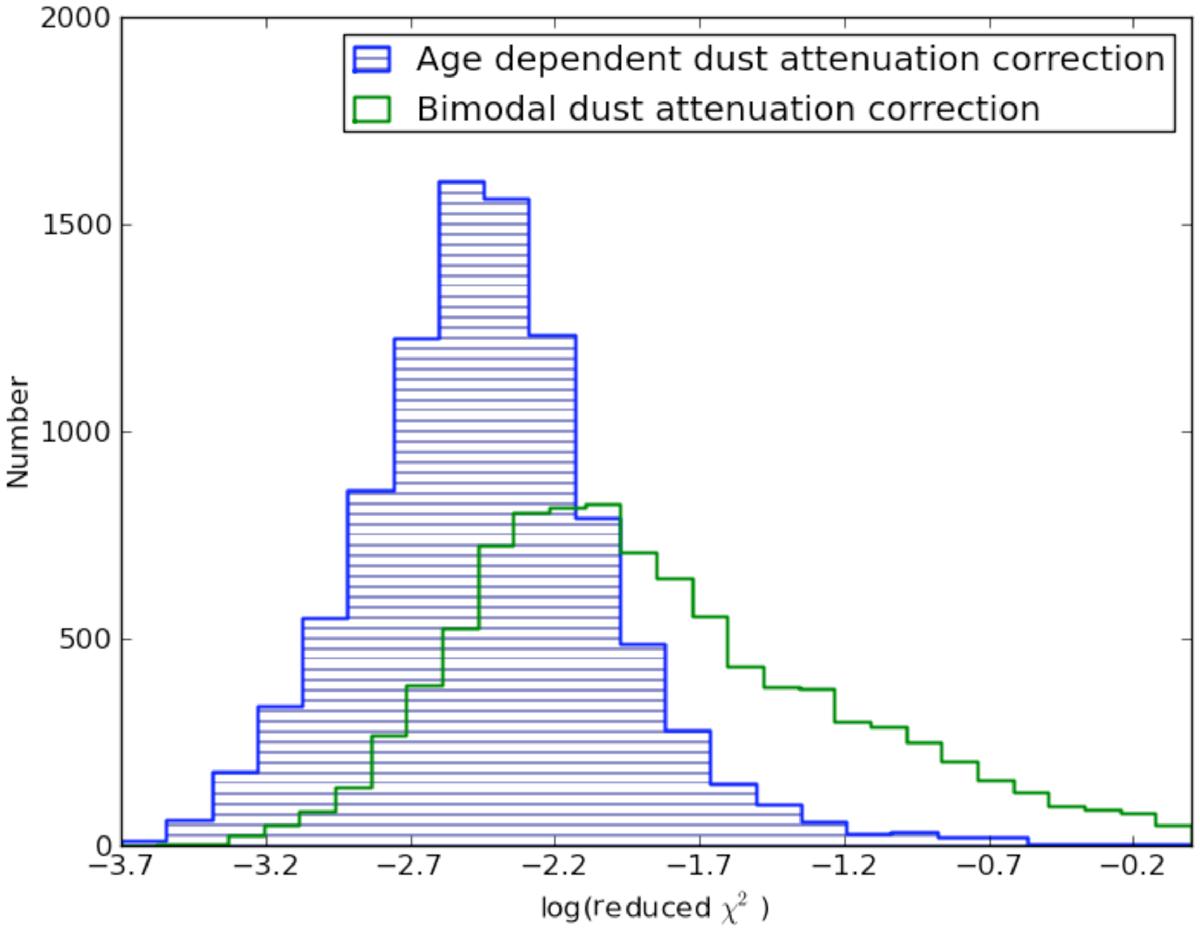
Reduced χ2 of the spectral fits adopting two different procedures for correction of dust attenuation. The hatched region shows the distribution after applying the corrections according to Table 3. The other line shows the distribution after we have applied the more classic approach with an extinction coefficient that is twice as high in star-forming regions compared to passive regions. Obviously the age dependent dust attenuation correction yields the smaller reduced χ2 values and thus gives the better fit.
Current usage metrics show cumulative count of Article Views (full-text article views including HTML views, PDF and ePub downloads, according to the available data) and Abstracts Views on Vision4Press platform.
Data correspond to usage on the plateform after 2015. The current usage metrics is available 48-96 hours after online publication and is updated daily on week days.
Initial download of the metrics may take a while.