Fig. 10
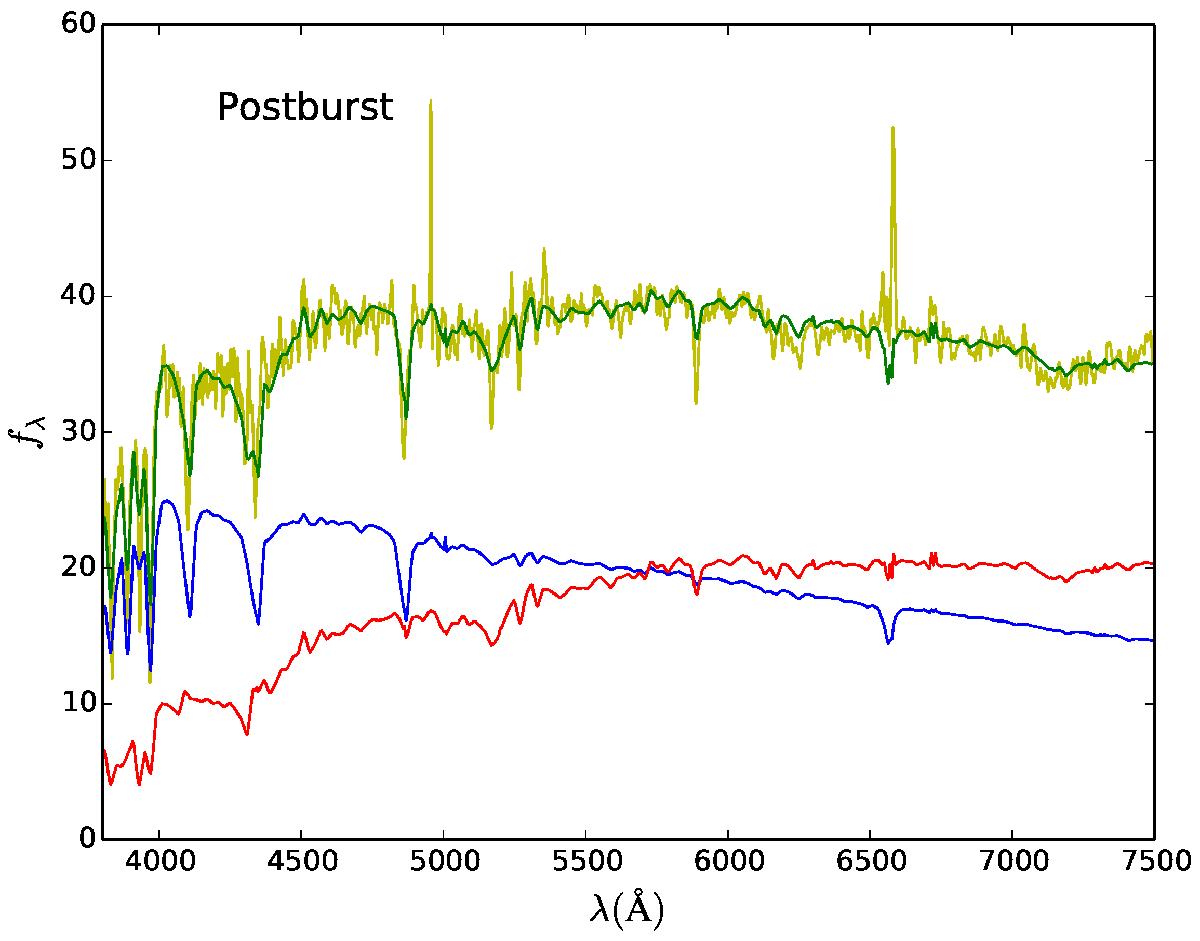
An example of a model of a postburst spectrum (SDSS SpecObjId 85508603053604864). Displayed are the two model components – a young (blue line) and an old (red line) stellar population. The sum of the model spectra (dark green line) is shown on top of the observed spectrum (light green line). The observed spectrum has been smoothed with a triangular filter with a width of 7 pixels. The bright emission line just below 5000 Å is a remnant from the [O i]λ5577 night sky line. The emission lines in the region around Hα are the [N ii]λλ6548, 6584 lines. Since no Hα is seen (although some is probably swallowed by the stellar absorption line), most of the nitrogen lines are probably originating from a weak AGN.
Current usage metrics show cumulative count of Article Views (full-text article views including HTML views, PDF and ePub downloads, according to the available data) and Abstracts Views on Vision4Press platform.
Data correspond to usage on the plateform after 2015. The current usage metrics is available 48-96 hours after online publication and is updated daily on week days.
Initial download of the metrics may take a while.