Free Access
Fig. 5
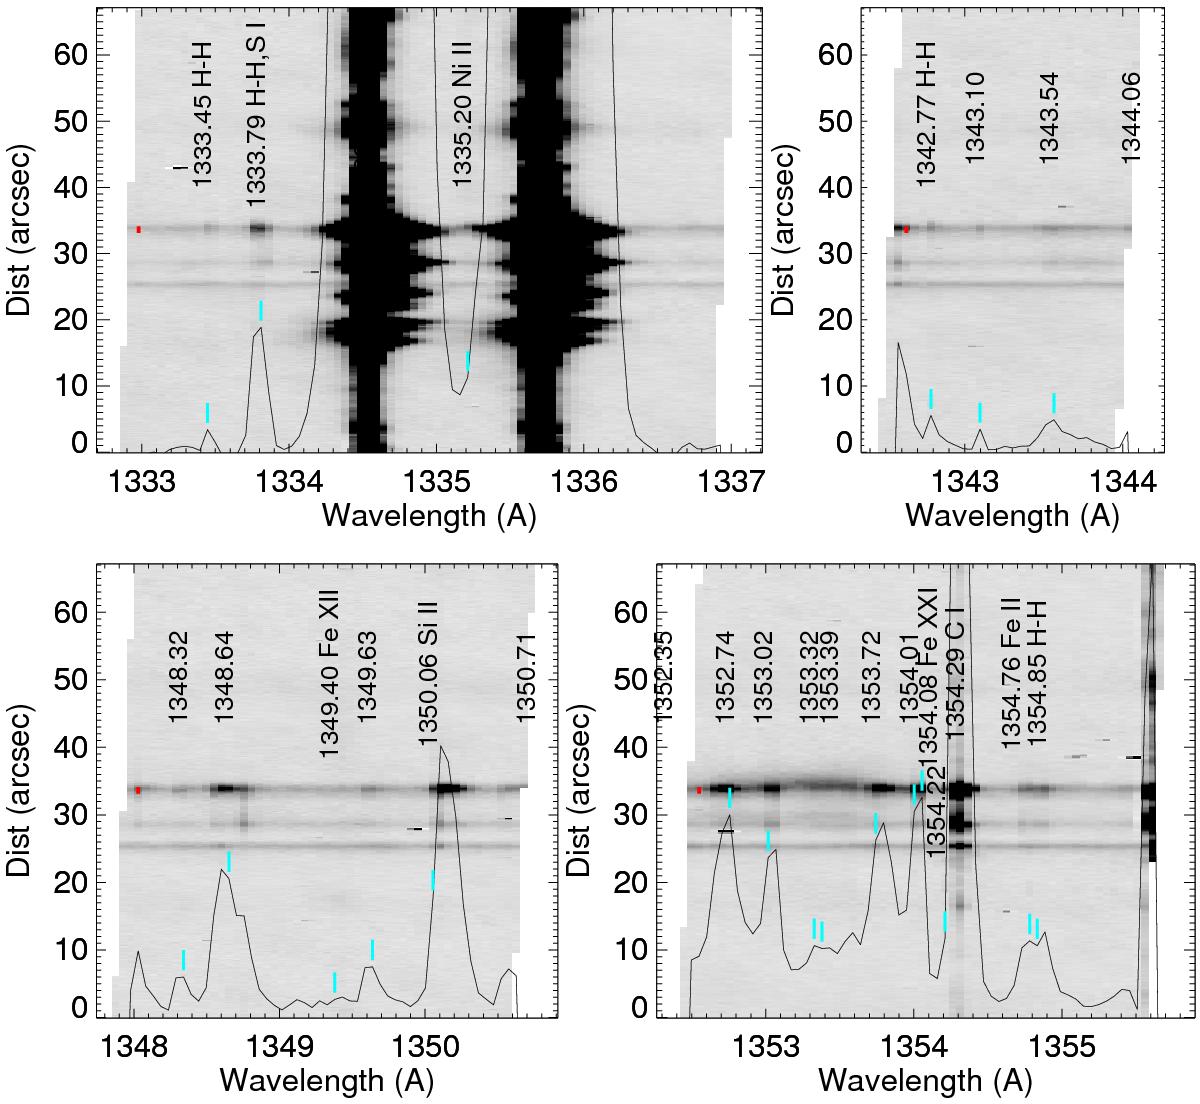
Flare footpoint spectra taken on 24 October 2013. The overplotted line spectra are the average across the small bright region marked by a red line on the left-hand side of each image. The main lines are labeled and indicated by light blue vertical ticks just above the line spectra.
Current usage metrics show cumulative count of Article Views (full-text article views including HTML views, PDF and ePub downloads, according to the available data) and Abstracts Views on Vision4Press platform.
Data correspond to usage on the plateform after 2015. The current usage metrics is available 48-96 hours after online publication and is updated daily on week days.
Initial download of the metrics may take a while.