Free Access
Fig. 3
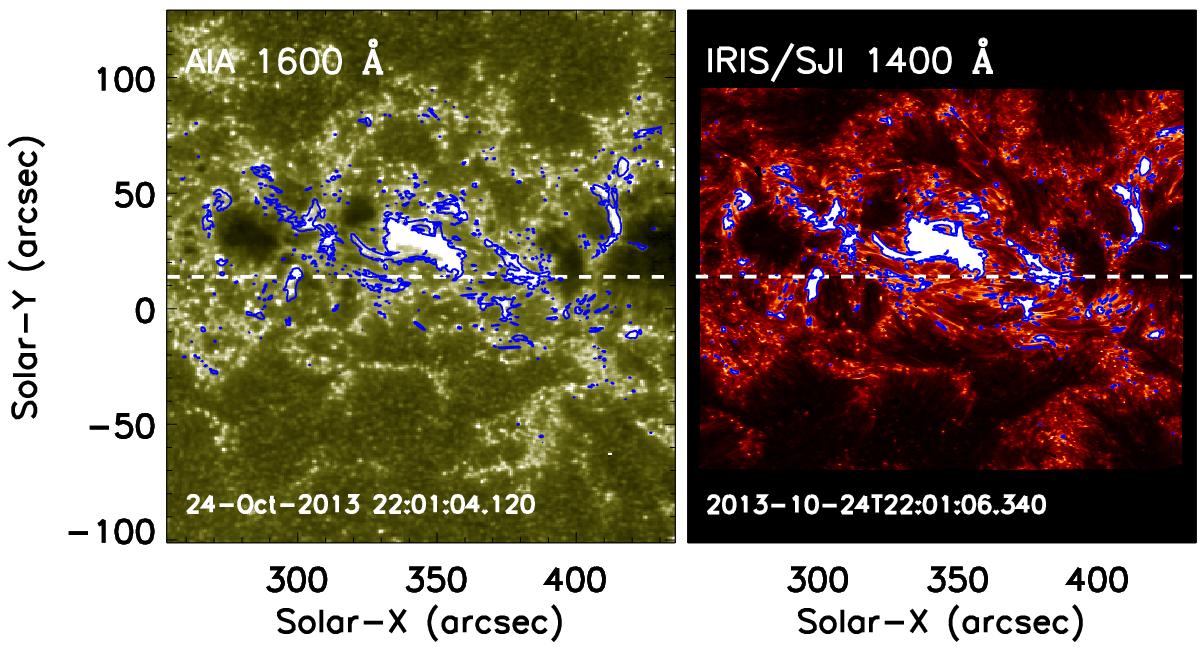
Coalignment of the SDO and IRIS images. Left: the AIA image at 1600 Å. Right: the SJ image at 1400 Å. The white dashed line is the IRIS slit position, and the blue contours are the SJ intensity at the level of 800 DN.
Current usage metrics show cumulative count of Article Views (full-text article views including HTML views, PDF and ePub downloads, according to the available data) and Abstracts Views on Vision4Press platform.
Data correspond to usage on the plateform after 2015. The current usage metrics is available 48-96 hours after online publication and is updated daily on week days.
Initial download of the metrics may take a while.