Fig. 2
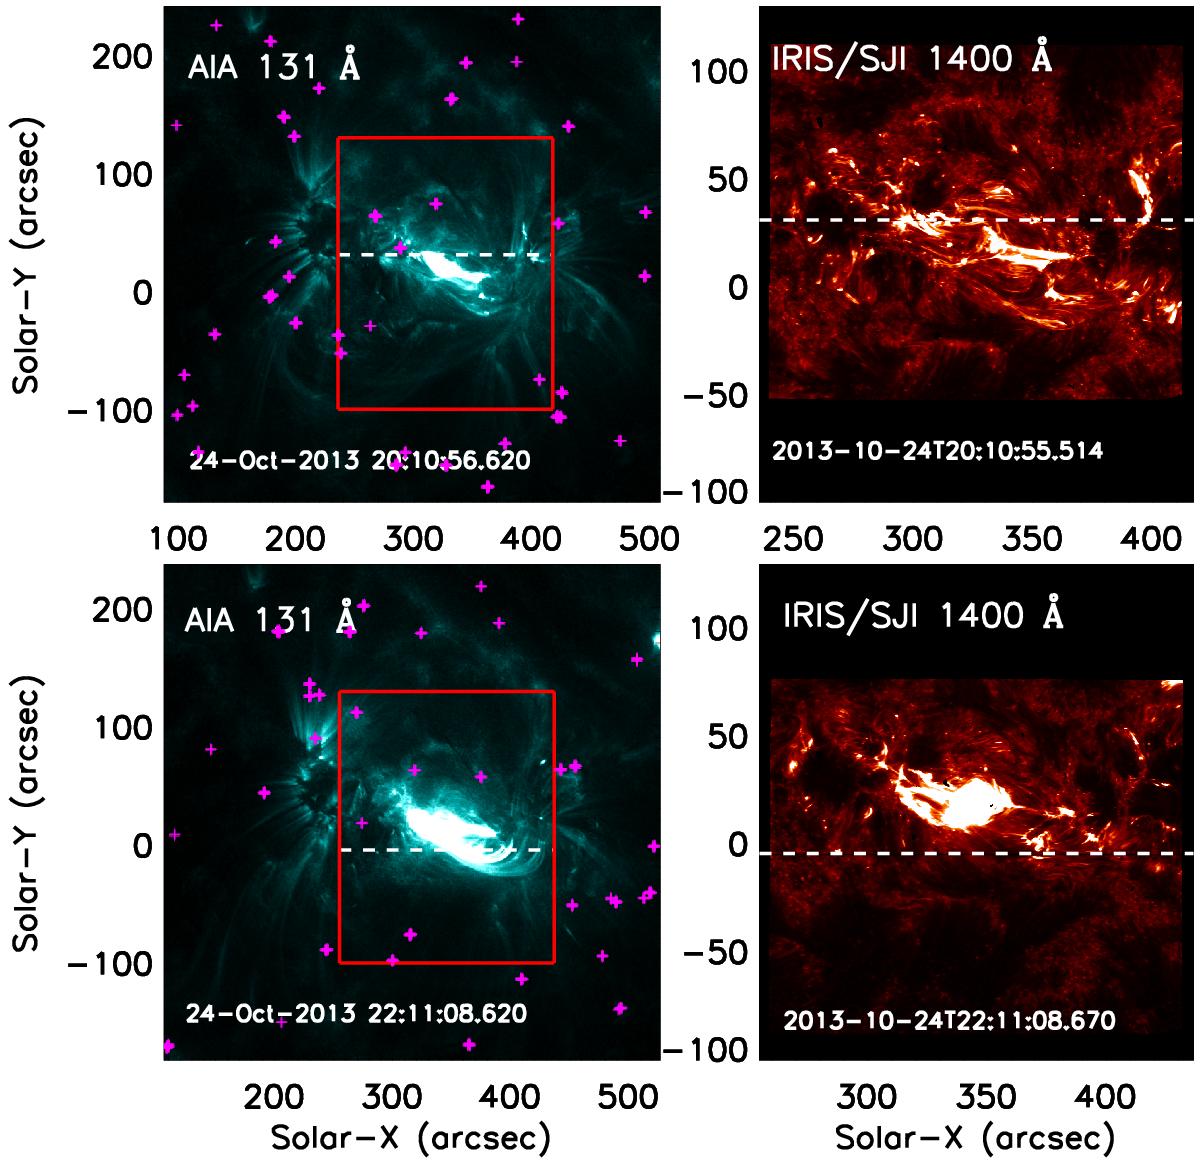
Left: AIA 131 Å images of the active region at the times of the two flares. The red boxes are the positions of the IRIS SJ images. Right: IRIS SJ 1400 Å images of the two flares analyzed. The position of the spectrometer slit at the start of the flare is seen as a white dashed horizontal line. The purple +’s indicate the re-spike pixels in the AIA 131 Å images with the code “aia_ respike”.
Current usage metrics show cumulative count of Article Views (full-text article views including HTML views, PDF and ePub downloads, according to the available data) and Abstracts Views on Vision4Press platform.
Data correspond to usage on the plateform after 2015. The current usage metrics is available 48-96 hours after online publication and is updated daily on week days.
Initial download of the metrics may take a while.