Fig. 18
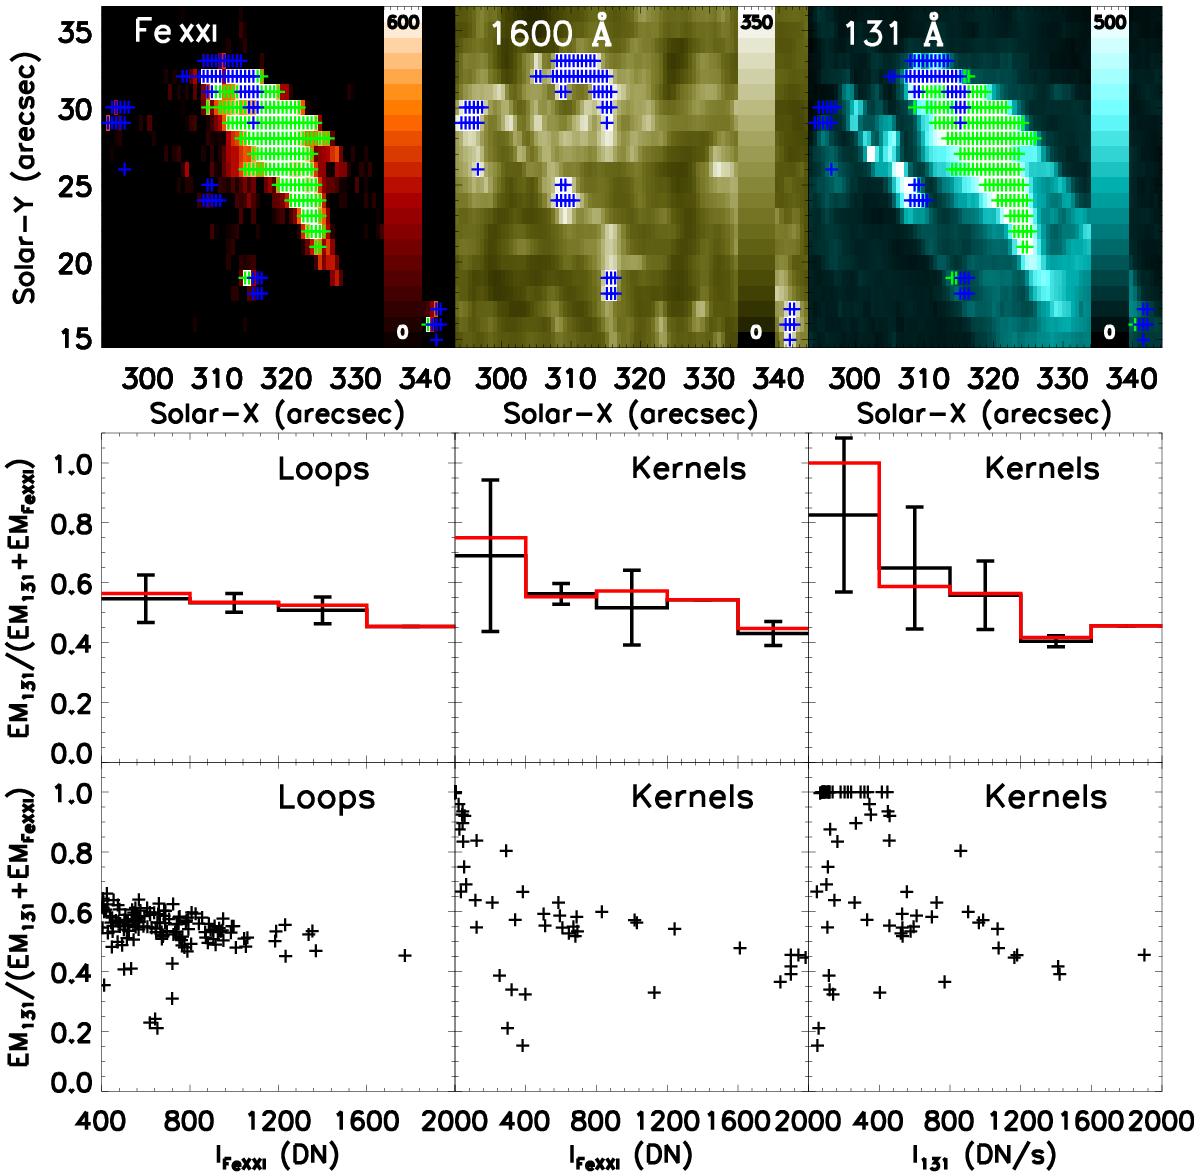
Quantitative analysis of the Fe xxi and 131 Å EMs for flare 1. The top row from left to right shows Fe xxi, 1600 Å, and 131 Å intensity. The middle panels show the mean and median (red line) ratios EM(131)/(EM(131)+EM(Fe xxi)) vs. Fe xxi intensity in loops (bin = 400 DN) and kernels (bin = 400 DN), and on the right the ratio EM(131)/(EM(131)+EM(Fe xxi)) vs. intensity of 131 Å (bin = 400 DN s-1). The bottom panels show the same ratios vs. intensity but as scatter plots. In the loops the mean, standard deviation, and median ratios are 0.54 ± 0.07 and0.55.
Current usage metrics show cumulative count of Article Views (full-text article views including HTML views, PDF and ePub downloads, according to the available data) and Abstracts Views on Vision4Press platform.
Data correspond to usage on the plateform after 2015. The current usage metrics is available 48-96 hours after online publication and is updated daily on week days.
Initial download of the metrics may take a while.